
 Yahoo Finance
 Is Goodwin PLC's(LON:GDWN) Recent Stock Performance Tethered To Its Strong Fundamentals?
Goodwin's (LON:GDWN) stock is up by a considerable 17% over the past three months. Since the market usually pay for a company’s long-term fundamentals, we decided to study the company’s key performance indicators to see if they could be influencing the market. Particularly, we will be paying attention to Goodwin's ROE today.
ROE or return on equity is a useful tool to assess how effectively a company can generate returns on the investment it received from its shareholders. In short, ROE shows the profit each dollar generates with respect to its shareholder investments.
See our latest analysis for Goodwin
How Do You Calculate Return On Equity?
The formula for return on equity is:
Return on Equity = Net Profit (from continuing operations) ÷ Shareholders' Equity
So, based on the above formula, the ROE for Goodwin is:
11% = UK£13m ÷ UK£118m (Based on the trailing twelve months to April 2021).
The 'return' is the profit over the last twelve months. So, this means that for every £1 of its shareholder's investments, the company generates a profit of £0.11.
What Is The Relationship Between ROE And Earnings Growth?
So far, we've learned that ROE is a measure of a company's profitability. We now need to evaluate how much profit the company reinvests or "retains" for future growth which then gives us an idea about the growth potential of the company. Generally speaking, other things being equal, firms with a high return on equity and profit retention, have a higher growth rate than firms that don’t share these attributes.
Goodwin's Earnings Growth And 11% ROE
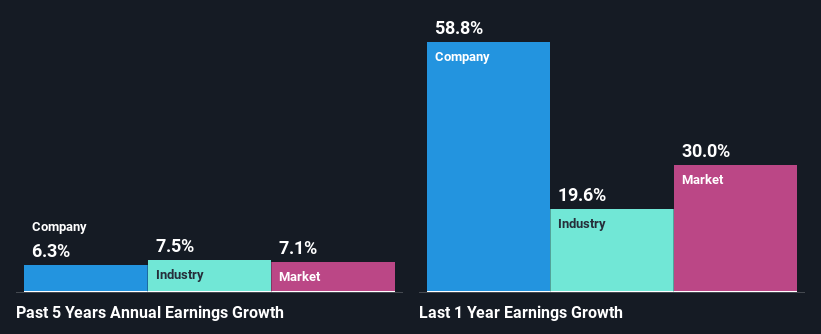
To begin with, Goodwin seems to have a respectable ROE. Even when compared to the industry average of 11% the company's ROE looks quite decent. This probably goes some way in explaining Goodwin's moderate 6.3% growth over the past five years amongst other factors.
As a next step, we compared Goodwin's net income growth with the industry and found that the company has a similar growth figure when compared with the industry average growth rate of 7.5% in the same period.
Earnings growth is a huge factor in stock valuation. What investors need to determine next is if the expected earnings growth, or the lack of it, is already built into the share price. This then helps them determine if the stock is placed for a bright or bleak future. Is Goodwin fairly valued compared to other companies? These 3 valuation measures might help you decide.
Is Goodwin Using Its Retained Earnings Effectively?
Goodwin has a significant three-year median payout ratio of 63%, meaning that it is left with only 37% to reinvest into its business. This implies that the company has been able to achieve decent earnings growth despite returning most of its profits to shareholders.
Besides, Goodwin has been paying dividends for at least ten years or more. This shows that the company is committed to sharing profits with its shareholders.
Summary
In total, we are pretty happy with Goodwin's performance. We are particularly impressed by the considerable earnings growth posted by the company, which was likely backed by its high ROE. While the company is paying out most of its earnings as dividends, it has been able to grow its earnings in spite of it, so that's probably a good sign. Up till now, we've only made a short study of the company's growth data. So it may be worth checking this free detailed graph of Goodwin's past earnings, as well as revenue and cash flows to get a deeper insight into the company's performance.
This article by Simply Wall St is general in nature. We provide commentary based on historical data and analyst forecasts only using an unbiased methodology and our articles are not intended to be financial advice. It does not constitute a recommendation to buy or sell any stock, and does not take account of your objectives, or your financial situation. We aim to bring you long-term focused analysis driven by fundamental data. Note that our analysis may not factor in the latest price-sensitive company announcements or qualitative material. Simply Wall St has no position in any stocks mentioned.
Have feedback on this article? Concerned about the content? Get in touch with us directly. Alternatively, email editorial-team (at) simplywallst.com.
