
 Yahoo Finance
 Graham (NYSE:GHM) Is Looking To Continue Growing Its Returns On Capital
What trends should we look for it we want to identify stocks that can multiply in value over the long term? Ideally, a business will show two trends; firstly a growing return on capital employed (ROCE) and secondly, an increasing amount of capital employed. Put simply, these types of businesses are compounding machines, meaning they are continually reinvesting their earnings at ever-higher rates of return. Speaking of which, we noticed some great changes in Graham's (NYSE:GHM) returns on capital, so let's have a look.
Understanding Return On Capital Employed (ROCE)
For those who don't know, ROCE is a measure of a company's yearly pre-tax profit (its return), relative to the capital employed in the business. To calculate this metric for Graham, this is the formula:
Return on Capital Employed = Earnings Before Interest and Tax (EBIT) ÷ (Total Assets - Current Liabilities)
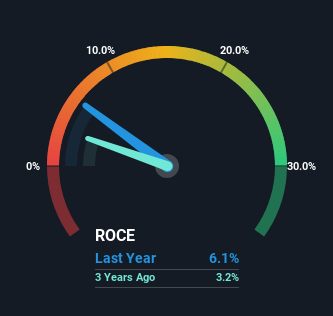
0.061 = US$7.0m ÷ (US$234m - US$118m) (Based on the trailing twelve months to March 2024).
Thus, Graham has an ROCE of 6.1%. In absolute terms, that's a low return and it also under-performs the Machinery industry average of 13%.
View our latest analysis for Graham
Above you can see how the current ROCE for Graham compares to its prior returns on capital, but there's only so much you can tell from the past. If you'd like to see what analysts are forecasting going forward, you should check out our free analyst report for Graham .
So How Is Graham's ROCE Trending?
Graham's ROCE growth is quite impressive. The figures show that over the last five years, ROCE has grown 27% whilst employing roughly the same amount of capital. So it's likely that the business is now reaping the full benefits of its past investments, since the capital employed hasn't changed considerably. The company is doing well in that sense, and it's worth investigating what the management team has planned for long term growth prospects.
On a side note, we noticed that the improvement in ROCE appears to be partly fueled by an increase in current liabilities. The current liabilities has increased to 51% of total assets, so the business is now more funded by the likes of its suppliers or short-term creditors. Given it's pretty high ratio, we'd remind investors that having current liabilities at those levels can bring about some risks in certain businesses.
The Key Takeaway
In summary, we're delighted to see that Graham has been able to increase efficiencies and earn higher rates of return on the same amount of capital. And with a respectable 54% awarded to those who held the stock over the last five years, you could argue that these developments are starting to get the attention they deserve. In light of that, we think it's worth looking further into this stock because if Graham can keep these trends up, it could have a bright future ahead.
On the other side of ROCE, we have to consider valuation. That's why we have a FREE intrinsic value estimation for GHM on our platform that is definitely worth checking out.
While Graham isn't earning the highest return, check out this free list of companies that are earning high returns on equity with solid balance sheets.
Have feedback on this article? Concerned about the content? Get in touch with us directly. Alternatively, email editorial-team (at) simplywallst.com.
This article by Simply Wall St is general in nature. We provide commentary based on historical data and analyst forecasts only using an unbiased methodology and our articles are not intended to be financial advice. It does not constitute a recommendation to buy or sell any stock, and does not take account of your objectives, or your financial situation. We aim to bring you long-term focused analysis driven by fundamental data. Note that our analysis may not factor in the latest price-sensitive company announcements or qualitative material. Simply Wall St has no position in any stocks mentioned.
Have feedback on this article? Concerned about the content? Get in touch with us directly. Alternatively, email editorial-team@simplywallst.com
