
 Yahoo Finance
 Grammer's (ETR:GMM) Returns Have Hit A Wall
Finding a business that has the potential to grow substantially is not easy, but it is possible if we look at a few key financial metrics. One common approach is to try and find a company with returns on capital employed (ROCE) that are increasing, in conjunction with a growing amount of capital employed. Basically this means that a company has profitable initiatives that it can continue to reinvest in, which is a trait of a compounding machine. Although, when we looked at Grammer (ETR:GMM), it didn't seem to tick all of these boxes.
What Is Return On Capital Employed (ROCE)?
For those who don't know, ROCE is a measure of a company's yearly pre-tax profit (its return), relative to the capital employed in the business. Analysts use this formula to calculate it for Grammer:
Return on Capital Employed = Earnings Before Interest and Tax (EBIT) ÷ (Total Assets - Current Liabilities)
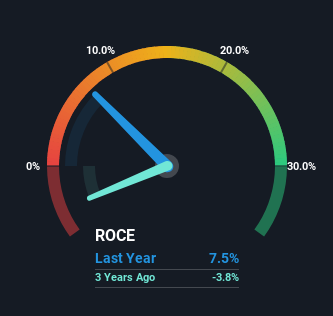
0.075 = €49m ÷ (€1.5b - €837m) (Based on the trailing twelve months to September 2023).
Therefore, Grammer has an ROCE of 7.5%. In absolute terms, that's a low return and it also under-performs the Auto Components industry average of 10%.
View our latest analysis for Grammer
Above you can see how the current ROCE for Grammer compares to its prior returns on capital, but there's only so much you can tell from the past. If you'd like to see what analysts are forecasting going forward, you should check out our free analyst report for Grammer .
What Does the ROCE Trend For Grammer Tell Us?
There hasn't been much to report for Grammer's returns and its level of capital employed because both metrics have been steady for the past five years. It's not uncommon to see this when looking at a mature and stable business that isn't re-investing its earnings because it has likely passed that phase of the business cycle. With that in mind, unless investment picks up again in the future, we wouldn't expect Grammer to be a multi-bagger going forward.
On another note, while the change in ROCE trend might not scream for attention, it's interesting that the current liabilities have actually gone up over the last five years. This is intriguing because if current liabilities hadn't increased to 56% of total assets, this reported ROCE would probably be less than7.5% because total capital employed would be higher.The 7.5% ROCE could be even lower if current liabilities weren't 56% of total assets, because the the formula would show a larger base of total capital employed. Additionally, this high level of current liabilities isn't ideal because it means the company's suppliers (or short-term creditors) are effectively funding a large portion of the business.
Our Take On Grammer's ROCE
We can conclude that in regards to Grammer's returns on capital employed and the trends, there isn't much change to report on. It seems that investors have little hope of these trends getting any better and that may have partly contributed to the stock collapsing 73% in the last five years. Therefore based on the analysis done in this article, we don't think Grammer has the makings of a multi-bagger.
If you'd like to know about the risks facing Grammer, we've discovered 1 warning sign that you should be aware of.
If you want to search for solid companies with great earnings, check out this free list of companies with good balance sheets and impressive returns on equity.
Have feedback on this article? Concerned about the content? Get in touch with us directly. Alternatively, email editorial-team (at) simplywallst.com.
This article by Simply Wall St is general in nature. We provide commentary based on historical data and analyst forecasts only using an unbiased methodology and our articles are not intended to be financial advice. It does not constitute a recommendation to buy or sell any stock, and does not take account of your objectives, or your financial situation. We aim to bring you long-term focused analysis driven by fundamental data. Note that our analysis may not factor in the latest price-sensitive company announcements or qualitative material. Simply Wall St has no position in any stocks mentioned.
