
 Yahoo Finance
 H&E Equipment Services' (NASDAQ:HEES) Stock Price Has Reduced 31% In The Past Year

H&E Equipment Services, Inc. (NASDAQ:HEES) shareholders should be happy to see the share price up 20% in the last quarter. But in truth the last year hasn't been good for the share price. In fact, the price has declined 31% in a year, falling short of the returns you could get by investing in an index fund.
View our latest analysis for H&E Equipment Services
To quote Buffett, 'Ships will sail around the world but the Flat Earth Society will flourish. There will continue to be wide discrepancies between price and value in the marketplace...' By comparing earnings per share (EPS) and share price changes over time, we can get a feel for how investor attitudes to a company have morphed over time.
Unfortunately H&E Equipment Services reported an EPS drop of 73% for the last year. This fall in the EPS is significantly worse than the 31% the share price fall. So despite the weak per-share profits, some investors are probably relieved the situation wasn't more difficult.
The graphic below depicts how EPS has changed over time (unveil the exact values by clicking on the image).
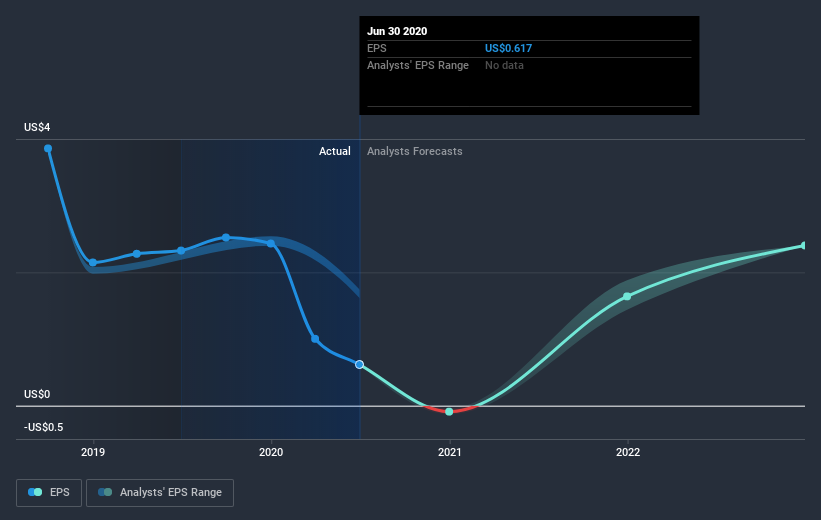
This free interactive report on H&E Equipment Services' earnings, revenue and cash flow is a great place to start, if you want to investigate the stock further.
What About Dividends?
When looking at investment returns, it is important to consider the difference between total shareholder return (TSR) and share price return. The TSR is a return calculation that accounts for the value of cash dividends (assuming that any dividend received was reinvested) and the calculated value of any discounted capital raisings and spin-offs. So for companies that pay a generous dividend, the TSR is often a lot higher than the share price return. We note that for H&E Equipment Services the TSR over the last year was -27%, which is better than the share price return mentioned above. The dividends paid by the company have thusly boosted the total shareholder return.
A Different Perspective
While the broader market gained around 20% in the last year, H&E Equipment Services shareholders lost 27% (even including dividends). Even the share prices of good stocks drop sometimes, but we want to see improvements in the fundamental metrics of a business, before getting too interested. On the bright side, long term shareholders have made money, with a gain of 8% per year over half a decade. It could be that the recent sell-off is an opportunity, so it may be worth checking the fundamental data for signs of a long term growth trend. It's always interesting to track share price performance over the longer term. But to understand H&E Equipment Services better, we need to consider many other factors. Even so, be aware that H&E Equipment Services is showing 4 warning signs in our investment analysis , and 1 of those is concerning...
We will like H&E Equipment Services better if we see some big insider buys. While we wait, check out this free list of growing companies with considerable, recent, insider buying.
Please note, the market returns quoted in this article reflect the market weighted average returns of stocks that currently trade on US exchanges.
This article by Simply Wall St is general in nature. It does not constitute a recommendation to buy or sell any stock, and does not take account of your objectives, or your financial situation. We aim to bring you long-term focused analysis driven by fundamental data. Note that our analysis may not factor in the latest price-sensitive company announcements or qualitative material. Simply Wall St has no position in any stocks mentioned.
Have feedback on this article? Concerned about the content? Get in touch with us directly. Alternatively, email editorial-team@simplywallst.com.