
 Yahoo Finance
 If You Had Bought Close Brothers Group (LON:CBG) Stock Three Years Ago, You Could Pocket A 27% Gain Today

By buying an index fund, you can roughly match the market return with ease. But many of us dare to dream of bigger returns, and build a portfolio ourselves. Just take a look at Close Brothers Group plc (LON:CBG), which is up 27%, over three years, soundly beating the market return of 18% (not including dividends). However, more recent returns haven't been as impressive as that, with the stock returning just 9.1% in the last year, including dividends.
Check out our latest analysis for Close Brothers Group
To paraphrase Benjamin Graham: Over the short term the market is a voting machine, but over the long term it's a weighing machine. One way to examine how market sentiment has changed over time is to look at the interaction between a company's share price and its earnings per share (EPS).
Close Brothers Group was able to grow its EPS at 3.6% per year over three years, sending the share price higher. In comparison, the 8.3% per year gain in the share price outpaces the EPS growth. So it's fair to assume the market has a higher opinion of the business than it did three years ago. It's not unusual to see the market 're-rate' a stock, after a few years of growth.
The company's earnings per share (over time) is depicted in the image below (click to see the exact numbers).
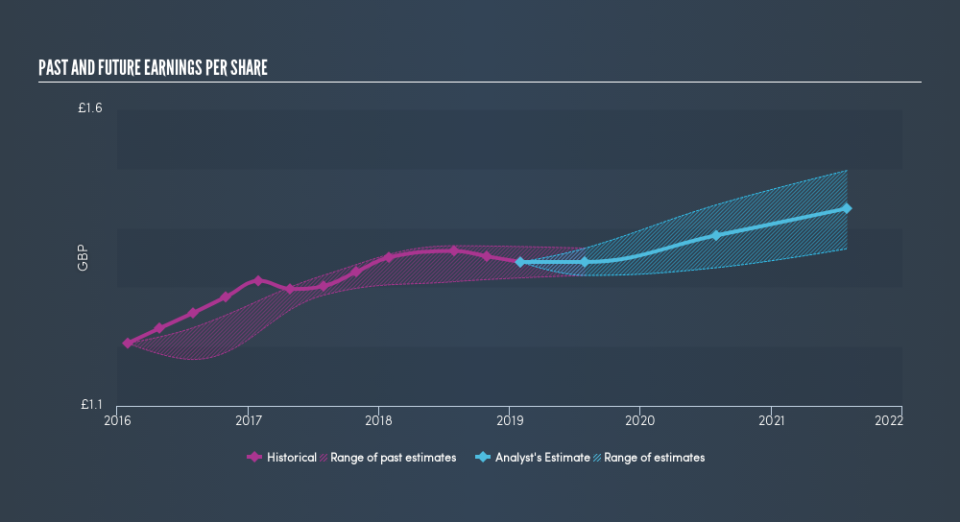
This free interactive report on Close Brothers Group's earnings, revenue and cash flow is a great place to start, if you want to investigate the stock further.
What About Dividends?
It is important to consider the total shareholder return, as well as the share price return, for any given stock. Whereas the share price return only reflects the change in the share price, the TSR includes the value of dividends (assuming they were reinvested) and the benefit of any discounted capital raising or spin-off. Arguably, the TSR gives a more comprehensive picture of the return generated by a stock. In the case of Close Brothers Group, it has a TSR of 44% for the last 3 years. That exceeds its share price return that we previously mentioned. And there's no prize for guessing that the dividend payments largely explain the divergence!
A Different Perspective
It's nice to see that Close Brothers Group shareholders have received a total shareholder return of 9.1% over the last year. Of course, that includes the dividend. That gain is better than the annual TSR over five years, which is 6.5%. Therefore it seems like sentiment around the company has been positive lately. In the best case scenario, this may hint at some real business momentum, implying that now could be a great time to delve deeper. Before spending more time on Close Brothers Group it might be wise to click here to see if insiders have been buying or selling shares.
For those who like to find winning investments this free list of growing companies with recent insider purchasing, could be just the ticket.
Please note, the market returns quoted in this article reflect the market weighted average returns of stocks that currently trade on GB exchanges.
We aim to bring you long-term focused research analysis driven by fundamental data. Note that our analysis may not factor in the latest price-sensitive company announcements or qualitative material.
If you spot an error that warrants correction, please contact the editor at editorial-team@simplywallst.com. This article by Simply Wall St is general in nature. It does not constitute a recommendation to buy or sell any stock, and does not take account of your objectives, or your financial situation. Simply Wall St has no position in the stocks mentioned. Thank you for reading.
