
 Yahoo Finance
 Here's What To Make Of Amazon.com's (NASDAQ:AMZN) Decelerating Rates Of Return
To find a multi-bagger stock, what are the underlying trends we should look for in a business? Ideally, a business will show two trends; firstly a growing return on capital employed (ROCE) and secondly, an increasing amount of capital employed. Ultimately, this demonstrates that it's a business that is reinvesting profits at increasing rates of return. With that in mind, the ROCE of Amazon.com (NASDAQ:AMZN) looks decent, right now, so lets see what the trend of returns can tell us.
Understanding Return On Capital Employed (ROCE)
Just to clarify if you're unsure, ROCE is a metric for evaluating how much pre-tax income (in percentage terms) a company earns on the capital invested in its business. To calculate this metric for Amazon.com, this is the formula:
Return on Capital Employed = Earnings Before Interest and Tax (EBIT) ÷ (Total Assets - Current Liabilities)
0.13 = US$47b ÷ (US$531b - US$153b) (Based on the trailing twelve months to March 2024).
Therefore, Amazon.com has an ROCE of 13%. That's a relatively normal return on capital, and it's around the 11% generated by the Multiline Retail industry.
See our latest analysis for Amazon.com
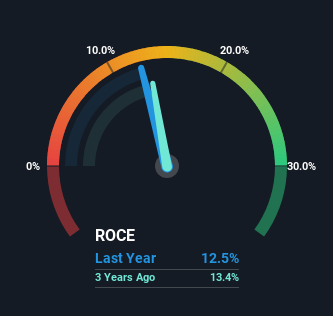
In the above chart we have measured Amazon.com's prior ROCE against its prior performance, but the future is arguably more important. If you'd like, you can check out the forecasts from the analysts covering Amazon.com for free.
How Are Returns Trending?
The trend of ROCE doesn't stand out much, but returns on a whole are decent. The company has employed 230% more capital in the last five years, and the returns on that capital have remained stable at 13%. 13% is a pretty standard return, and it provides some comfort knowing that Amazon.com has consistently earned this amount. Stable returns in this ballpark can be unexciting, but if they can be maintained over the long run, they often provide nice rewards to shareholders.
In Conclusion...
In the end, Amazon.com has proven its ability to adequately reinvest capital at good rates of return. And since the stock has risen strongly over the last five years, it appears the market might expect this trend to continue. So even though the stock might be more "expensive" than it was before, we think the strong fundamentals warrant this stock for further research.
If you're still interested in Amazon.com it's worth checking out our FREE intrinsic value approximation for AMZN to see if it's trading at an attractive price in other respects.
While Amazon.com may not currently earn the highest returns, we've compiled a list of companies that currently earn more than 25% return on equity. Check out this free list here.
Have feedback on this article? Concerned about the content? Get in touch with us directly. Alternatively, email editorial-team (at) simplywallst.com.
This article by Simply Wall St is general in nature. We provide commentary based on historical data and analyst forecasts only using an unbiased methodology and our articles are not intended to be financial advice. It does not constitute a recommendation to buy or sell any stock, and does not take account of your objectives, or your financial situation. We aim to bring you long-term focused analysis driven by fundamental data. Note that our analysis may not factor in the latest price-sensitive company announcements or qualitative material. Simply Wall St has no position in any stocks mentioned.
Have feedback on this article? Concerned about the content? Get in touch with us directly. Alternatively, email editorial-team@simplywallst.com

