
 Yahoo Finance
 Here's How P/E Ratios Can Help Us Understand Arch Coal, Inc. (NYSE:ARCH)

Today, we'll introduce the concept of the P/E ratio for those who are learning about investing. We'll look at Arch Coal, Inc.'s (NYSE:ARCH) P/E ratio and reflect on what it tells us about the company's share price. What is Arch Coal's P/E ratio? Well, based on the last twelve months it is 4.18. That is equivalent to an earnings yield of about 24%.
Check out our latest analysis for Arch Coal
How Do I Calculate A Price To Earnings Ratio?
The formula for P/E is:
Price to Earnings Ratio = Share Price ÷ Earnings per Share (EPS)
Or for Arch Coal:
P/E of 4.18 = $80.57 ÷ $19.26 (Based on the year to June 2019.)
Is A High Price-to-Earnings Ratio Good?
A higher P/E ratio means that investors are paying a higher price for each $1 of company earnings. That isn't necessarily good or bad, but a high P/E implies relatively high expectations of what a company can achieve in the future.
How Does Arch Coal's P/E Ratio Compare To Its Peers?
The P/E ratio indicates whether the market has higher or lower expectations of a company. The image below shows that Arch Coal has a lower P/E than the average (9.9) P/E for companies in the oil and gas industry.
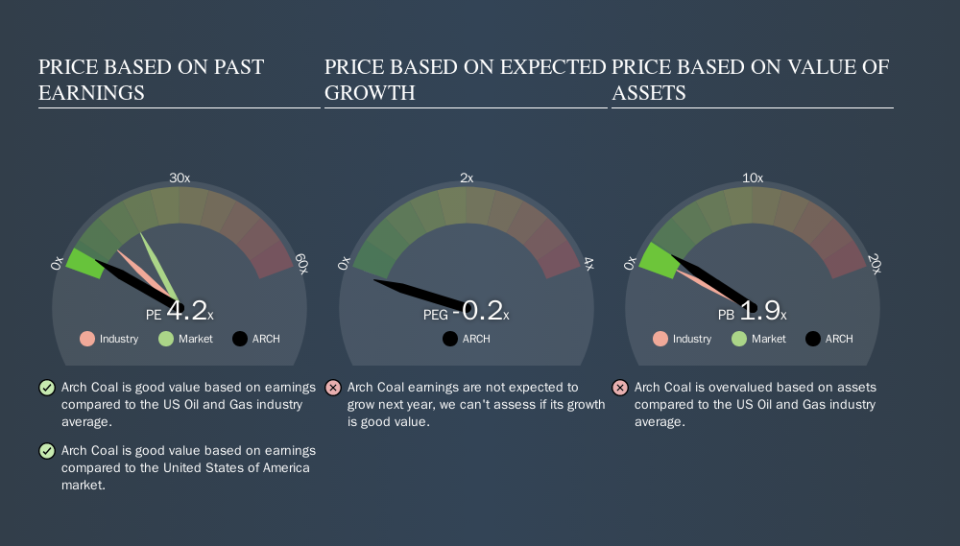
Its relatively low P/E ratio indicates that Arch Coal shareholders think it will struggle to do as well as other companies in its industry classification. While current expectations are low, the stock could be undervalued if the situation is better than the market assumes. It is arguably worth checking if insiders are buying shares, because that might imply they believe the stock is undervalued.
How Growth Rates Impact P/E Ratios
Probably the most important factor in determining what P/E a company trades on is the earnings growth. When earnings grow, the 'E' increases, over time. That means unless the share price increases, the P/E will reduce in a few years. So while a stock may look expensive based on past earnings, it could be cheap based on future earnings.
Arch Coal's earnings made like a rocket, taking off 64% last year.
A Limitation: P/E Ratios Ignore Debt and Cash In The Bank
Don't forget that the P/E ratio considers market capitalization. Thus, the metric does not reflect cash or debt held by the company. The exact same company would hypothetically deserve a higher P/E ratio if it had a strong balance sheet, than if it had a weak one with lots of debt, because a cashed up company can spend on growth.
Spending on growth might be good or bad a few years later, but the point is that the P/E ratio does not account for the option (or lack thereof).
How Does Arch Coal's Debt Impact Its P/E Ratio?
Since Arch Coal holds net cash of US$84m, it can spend on growth, justifying a higher P/E ratio than otherwise.
The Bottom Line On Arch Coal's P/E Ratio
Arch Coal trades on a P/E ratio of 4.2, which is below the US market average of 18.2. It grew its EPS nicely over the last year, and the healthy balance sheet implies there is more potential for growth. The below average P/E ratio suggests that market participants don't believe the strong growth will continue.
When the market is wrong about a stock, it gives savvy investors an opportunity. If the reality for a company is not as bad as the P/E ratio indicates, then the share price should increase as the market realizes this. So this free visual report on analyst forecasts could hold the key to an excellent investment decision.
Of course, you might find a fantastic investment by looking at a few good candidates. So take a peek at this free list of companies with modest (or no) debt, trading on a P/E below 20.
We aim to bring you long-term focused research analysis driven by fundamental data. Note that our analysis may not factor in the latest price-sensitive company announcements or qualitative material.
If you spot an error that warrants correction, please contact the editor at editorial-team@simplywallst.com. This article by Simply Wall St is general in nature. It does not constitute a recommendation to buy or sell any stock, and does not take account of your objectives, or your financial situation. Simply Wall St has no position in the stocks mentioned. Thank you for reading.
