
 Yahoo Finance
 Here's How P/E Ratios Can Help Us Understand Sinclair Broadcast Group, Inc. (NASDAQ:SBGI)

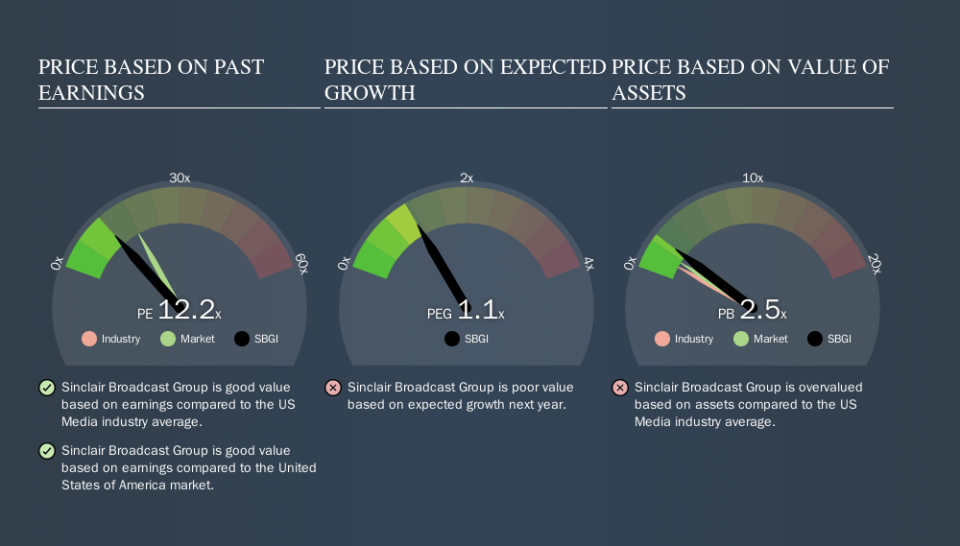
The goal of this article is to teach you how to use price to earnings ratios (P/E ratios). We'll look at Sinclair Broadcast Group, Inc.'s (NASDAQ:SBGI) P/E ratio and reflect on what it tells us about the company's share price. Looking at earnings over the last twelve months, Sinclair Broadcast Group has a P/E ratio of 12.18. That is equivalent to an earnings yield of about 8.2%.
Check out our latest analysis for Sinclair Broadcast Group
How Do I Calculate A Price To Earnings Ratio?
The formula for price to earnings is:
Price to Earnings Ratio = Price per Share ÷ Earnings per Share (EPS)
Or for Sinclair Broadcast Group:
P/E of 12.18 = $42.43 ÷ $3.48 (Based on the year to June 2019.)
Is A High Price-to-Earnings Ratio Good?
A higher P/E ratio means that investors are paying a higher price for each $1 of company earnings. That isn't a good or a bad thing on its own, but a high P/E means that buyers have a higher opinion of the business's prospects, relative to stocks with a lower P/E.
Does Sinclair Broadcast Group Have A Relatively High Or Low P/E For Its Industry?
The P/E ratio indicates whether the market has higher or lower expectations of a company. You can see in the image below that the average P/E (12.8) for companies in the media industry is roughly the same as Sinclair Broadcast Group's P/E.
Sinclair Broadcast Group's P/E tells us that market participants think its prospects are roughly in line with its industry. The company could surprise by performing better than average, in the future. Further research into factors such as insider buying and selling, could help you form your own view on whether that is likely.
How Growth Rates Impact P/E Ratios
P/E ratios primarily reflect market expectations around earnings growth rates. Earnings growth means that in the future the 'E' will be higher. That means unless the share price increases, the P/E will reduce in a few years. And as that P/E ratio drops, the company will look cheap, unless its share price increases.
Sinclair Broadcast Group saw earnings per share decrease by 35% last year. But it has grown its earnings per share by 28% per year over the last five years.
Don't Forget: The P/E Does Not Account For Debt or Bank Deposits
It's important to note that the P/E ratio considers the market capitalization, not the enterprise value. Thus, the metric does not reflect cash or debt held by the company. Hypothetically, a company could reduce its future P/E ratio by spending its cash (or taking on debt) to achieve higher earnings.
Spending on growth might be good or bad a few years later, but the point is that the P/E ratio does not account for the option (or lack thereof).
Is Debt Impacting Sinclair Broadcast Group's P/E?
Sinclair Broadcast Group's net debt is 72% of its market cap. If you want to compare its P/E ratio to other companies, you should absolutely keep in mind it has significant borrowings.
The Bottom Line On Sinclair Broadcast Group's P/E Ratio
Sinclair Broadcast Group trades on a P/E ratio of 12.2, which is below the US market average of 17.6. Given meaningful debt, and a lack of recent growth, the market looks to be extrapolating this recent performance; reflecting low expectations for the future.
When the market is wrong about a stock, it gives savvy investors an opportunity. If the reality for a company is not as bad as the P/E ratio indicates, then the share price should increase as the market realizes this. So this free visualization of the analyst consensus on future earnings could help you make the right decision about whether to buy, sell, or hold.
But note: Sinclair Broadcast Group may not be the best stock to buy. So take a peek at this free list of interesting companies with strong recent earnings growth (and a P/E ratio below 20).
We aim to bring you long-term focused research analysis driven by fundamental data. Note that our analysis may not factor in the latest price-sensitive company announcements or qualitative material.
If you spot an error that warrants correction, please contact the editor at editorial-team@simplywallst.com. This article by Simply Wall St is general in nature. It does not constitute a recommendation to buy or sell any stock, and does not take account of your objectives, or your financial situation. Simply Wall St has no position in the stocks mentioned. Thank you for reading.
