
 Yahoo Finance
 Here's What We Think About Marston's PLC's (LON:MARS) CEO Pay

In 2001, Ralph Findlay was appointed CEO of Marston's PLC (LON:MARS). This analysis aims first to contrast CEO compensation with other companies that have similar market capitalization. Next, we'll consider growth that the business demonstrates. And finally - as a second measure of performance - we will look at the returns shareholders have received over the last few years. This process should give us an idea about how appropriately the CEO is paid.
Check out our latest analysis for Marston's
How Does Ralph Findlay's Compensation Compare With Similar Sized Companies?
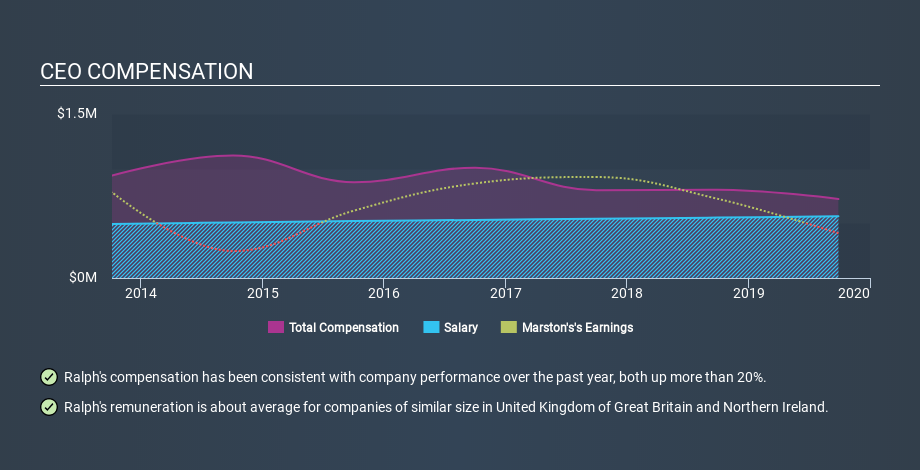
Our data indicates that Marston's PLC is worth UK£418m, and total annual CEO compensation was reported as UK£722k for the year to September 2019. While we always look at total compensation first, we note that the salary component is less, at UK£564k. When we examined a selection of companies with market caps ranging from UK£164m to UK£657m, we found the median CEO total compensation was UK£776k.
Next, let's break down remuneration compositions to understand how the industry and company compare with each other. Talking in terms of the sector, salary represented approximately 60% of total compensation out of all the companies we analysed, while other remuneration made up 40% of the pie. Marston's pays out 78% of aggregate payment in the shape of a salary, which is significantly higher than the industry average.
So Ralph Findlay is paid around the average of the companies we looked at. This doesn't tell us a whole lot on its own, but looking at the performance of the actual business will give us useful context. The graphic below shows how CEO compensation at Marston's has changed from year to year.
Is Marston's PLC Growing?
Over the last three years Marston's PLC has shrunk its earnings per share by an average of 40% per year (measured with a line of best fit). It achieved revenue growth of 2.8% over the last year.
Sadly for shareholders, earnings per share are actually down, over three years. The modest increase in revenue in the last year isn't enough to make me overlook the disappointing change in earnings per share. So given this relatively weak performance, shareholders would probably not want to see high compensation for the CEO. It could be important to check this free visual depiction of what analysts expect for the future.
Has Marston's PLC Been A Good Investment?
With a three year total loss of 42%, Marston's PLC would certainly have some dissatisfied shareholders. It therefore might be upsetting for shareholders if the CEO were paid generously.
In Summary...
Remuneration for Ralph Findlay is close enough to the median pay for a CEO of a similar sized company .
The company isn't growing EPS, and shareholder returns have been disappointing. Most would consider it prudent for the company to hold off any CEO pay rise until performance improves. On another note, Marston's has 3 warning signs (and 1 which doesn't sit too well with us) we think you should know about.
Important note: Marston's may not be the best stock to buy. You might find something better in this list of interesting companies with high ROE and low debt.
Love or hate this article? Concerned about the content? Get in touch with us directly. Alternatively, email editorial-team@simplywallst.com.
This article by Simply Wall St is general in nature. It does not constitute a recommendation to buy or sell any stock, and does not take account of your objectives, or your financial situation. We aim to bring you long-term focused analysis driven by fundamental data. Note that our analysis may not factor in the latest price-sensitive company announcements or qualitative material. Simply Wall St has no position in any stocks mentioned. Thank you for reading.
