
 Yahoo Finance
 HOCHTIEF (ETR:HOT) Will Be Hoping To Turn Its Returns On Capital Around
Did you know there are some financial metrics that can provide clues of a potential multi-bagger? One common approach is to try and find a company with returns on capital employed (ROCE) that are increasing, in conjunction with a growing amount of capital employed. Put simply, these types of businesses are compounding machines, meaning they are continually reinvesting their earnings at ever-higher rates of return. However, after investigating HOCHTIEF (ETR:HOT), we don't think it's current trends fit the mold of a multi-bagger.
Return On Capital Employed (ROCE): What Is It?
For those who don't know, ROCE is a measure of a company's yearly pre-tax profit (its return), relative to the capital employed in the business. Analysts use this formula to calculate it for HOCHTIEF:
Return on Capital Employed = Earnings Before Interest and Tax (EBIT) ÷ (Total Assets - Current Liabilities)
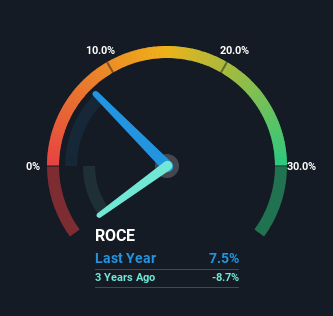
0.075 = €596m ÷ (€19b - €11b) (Based on the trailing twelve months to March 2024).
Thus, HOCHTIEF has an ROCE of 7.5%. Ultimately, that's a low return and it under-performs the Construction industry average of 11%.
Check out our latest analysis for HOCHTIEF
Above you can see how the current ROCE for HOCHTIEF compares to its prior returns on capital, but there's only so much you can tell from the past. If you'd like, you can check out the forecasts from the analysts covering HOCHTIEF for free.
So How Is HOCHTIEF's ROCE Trending?
In terms of HOCHTIEF's historical ROCE movements, the trend isn't fantastic. Over the last five years, returns on capital have decreased to 7.5% from 16% five years ago. Meanwhile, the business is utilizing more capital but this hasn't moved the needle much in terms of sales in the past 12 months, so this could reflect longer term investments. It's worth keeping an eye on the company's earnings from here on to see if these investments do end up contributing to the bottom line.
Another thing to note, HOCHTIEF has a high ratio of current liabilities to total assets of 58%. This can bring about some risks because the company is basically operating with a rather large reliance on its suppliers or other sorts of short-term creditors. While it's not necessarily a bad thing, it can be beneficial if this ratio is lower.
What We Can Learn From HOCHTIEF's ROCE
To conclude, we've found that HOCHTIEF is reinvesting in the business, but returns have been falling. Unsurprisingly, the stock has only gained 20% over the last five years, which potentially indicates that investors are accounting for this going forward. Therefore, if you're looking for a multi-bagger, we'd propose looking at other options.
On a separate note, we've found 1 warning sign for HOCHTIEF you'll probably want to know about.
For those who like to invest in solid companies, check out this free list of companies with solid balance sheets and high returns on equity.
Have feedback on this article? Concerned about the content? Get in touch with us directly. Alternatively, email editorial-team (at) simplywallst.com.
This article by Simply Wall St is general in nature. We provide commentary based on historical data and analyst forecasts only using an unbiased methodology and our articles are not intended to be financial advice. It does not constitute a recommendation to buy or sell any stock, and does not take account of your objectives, or your financial situation. We aim to bring you long-term focused analysis driven by fundamental data. Note that our analysis may not factor in the latest price-sensitive company announcements or qualitative material. Simply Wall St has no position in any stocks mentioned.
