
 Yahoo Finance
 New Home Sales Soar, Price Falls: Is Housing Mayhem Over?
Sales of new U.S. single-family homes surged unexpectedly to the highest level since March this year in August. Encouragingly, home prices also declined. So, are these signaling a rebound in the U.S. housing market?
August Sales Numbers
New home sales — a leading housing market indicator based on signed contracts, not closings — increased 28.8% to a seasonally adjusted annual rate of 685,000 units in August from July, according to the Commerce Department's report released Tuesday. This marks the highest level since March 2022. August’s sales pace was down 0.1% from the year-ago level. Last month’s figure also exceeded analysts’ expectation of 506,000 by 35.4%.
Geographically, the surge was the strongest in the Northeast, climbing 66.7%. Sales rose 29.4%, 27.5% and 16.7% in the South, West and Midwest, respectively.
Home Prices Fall
The median price for a new home sold last month was $436,800, down from $466,300 in the prior month. August’s price level was up 8% from a year ago, but marks the smallest increase since November 2020.
Meanwhile, according to the latest reading of the S&P Corelogic Case-Shiller House Price Index, home price gains decelerated across the country. The S&P CoreLogic Case-Shiller U.S. National Home Price NSA Index, covering all nine U.S. census divisions, reported a 15.8% annual rise in July, down from the 18.1% growth rate registered in June. The S&P CoreLogic Case-Shiller House Price Index fell 0.4% month over month in July for the first time in 10 years.
A Rebound for U.S. Housing?
The solid sales pace in August most likely depicts buyers’ willingness to capitalize on price cuts by builders as well as to purchase a home before there are further increases in borrowing costs.
The Fed's determination to curtail inflation through interest rate increases and quantitative tightening has started to show the desired effect of slowing down sales in markets across the country. In September 2022, the Fed approved its third consecutive interest rate rise of 0.75 percentage points and signaled that additional large increases are likely at the upcoming meetings to combat 40-year-high inflation.
The rate hike takes the central bank’s benchmark interest rate — the federal funds rate — to a new range of 3.0% to 3.25% — its highest level since 2008 — from between 2.25% and 2.5%. Officials expect the Fed funds rate to rise to 4.4% by the end of 2022 and 4.6% by the end of 2023. Hence, it is up from 3.4% for this year and 3.8% previously.
Consequently, the highly interest-rate-sensitive housing sector in the United States has been significantly impacted by rising mortgage rates. The 30-year fixed mortgage rate averaged 6.29% last week, the highest since October 2008 compared with 6.02% in the prior week, according to data from mortgage finance agency Freddie Mac.In the year-ago period, the mortgage rate averaged 2.88%. With the rapid acceleration of mortgage rates, home-price appreciation began to cool off as housing demand is slowing down.
Overall, August data for U.S. housing remains mixed. Building permits — a key indicator in projecting future housing starts — to build new houses slumped in August. Building permits dropped 10% from July to the lowest level in two years. Nonetheless, housing starts unexpectedly rose by over 12% and were down 0.1% from a year ago, according to the U.S. Census Bureau.
This latest growth in new housing starts is encouraging for the housing market as inventory remains tight. The shortage in supply has played a key role in pushing home prices higher.
Then again, with the risk of further rise in borrowing costs — as Fed policymakers are considering more hikes to combat rapid inflation — the U.S. housing market will most likely face the consequences.
Homebuilders also remained concerned as depicted in the latest National Association of Home Builders (NAHB)/Wells Fargo’s Housing Market Index (HMI). Sentiment among U.S. homebuilders for newly-built, single-family homes slipped to the lowest level since May 2020 in September 2022.
However, barring the readings for April and May 2020 (when HMI fell to 30 and 37, respectively), the September 2022 reading of 46 marks the lowest level since May 2014. High home prices, above 6% mortgage rates and back-to-back interest rate hikes make it difficult for entry-level and first-time buyers to indulge in such activity.
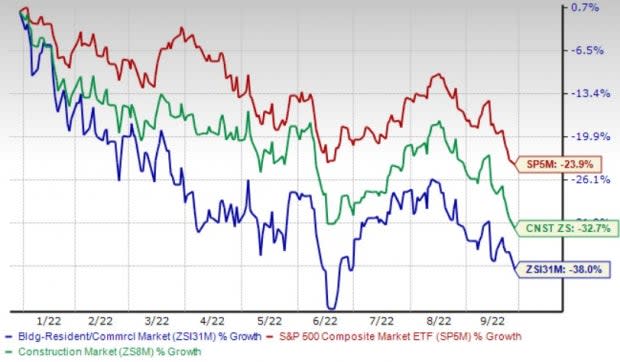
Image Source: Zacks Investment Research
The Zacks Building Products - Home Builders industry has lagged the S&P 500 Index and broader Zacks Construction sector year to date. Notable homebuilders like KB Home KBH, Lennar LEN, D.R. Horton DHI and Toll Brothers TOL have slumped 36.8%, 37.8%, 43.6% and 43%, respectively, this year.
Recently, KB Home, a Zacks Rank #5 (Strong Sell) company, reported mixed results in third-quarter fiscal 2022 (ended Aug 31, 2022), with earnings surpassing the Zacks Consensus Estimate and revenues missing the same. On a year-over-year basis, the metrics increased, despite prevailing industry headwinds and moderate housing demand, given the solid backlog level. You can see the complete list of today’s Zacks #1 Rank (Strong Buy) stocks here.
Lennar, a Zacks Rank #3 (Hold) company, also reported its third-quarter fiscal 2022 (ended May 31, 2022) results, wherein quarterly earnings topped the Zacks Consensus Estimate but revenues missed the same amid rising interest rates. Pertaining to the quarterly release, Stuart Miller, executive chairman of Lennar, said, "While our new orders declined 12% compared to last year's third quarter, we continued to maintain a consistent starts pace and drive sales by adjusting pricing and incentives.
Sales have clearly been impacted by rising interest rates, but there remains a significant national shortage of housing, especially workforce housing, and demand remains strong as we navigate the rebalance between price and interest rates."
D.R. Horton, a Zacks Rank #4 (Sell) stock, is expected to witness a 41.4% year-over-year improvement in fiscal fourth-quarter earnings. Also, revenues are likely to gain 25.9% from the prior-year levels. However, DHI’s earnings per share are expected to register a 20.7% decline in fiscal 2023 after the expected 49.7% growth in fiscal 2022.
Toll Brothers, a Zacks Rank #5 (Strong Sell) company, is expected to witness a 30.8% year-over-year improvement in fiscal fourth-quarter earnings. Also, revenues are likely to gain 9.4% from the prior-year levels. However, TOL’s earnings per share are expected to register a 10.6% decline in fiscal 2023 after the expected 40.6% growth in fiscal 2022.
Want the latest recommendations from Zacks Investment Research? Today, you can download 7 Best Stocks for the Next 30 Days. Click to get this free report
Toll Brothers Inc. (TOL) : Free Stock Analysis Report
KB Home (KBH) : Free Stock Analysis Report
Lennar Corporation (LEN) : Free Stock Analysis Report
D.R. Horton, Inc. (DHI) : Free Stock Analysis Report
To read this article on Zacks.com click here.
Zacks Investment Research