
 Yahoo Finance
 Huron Consulting Group (NASDAQ:HURN) Is Doing The Right Things To Multiply Its Share Price
If we want to find a stock that could multiply over the long term, what are the underlying trends we should look for? Amongst other things, we'll want to see two things; firstly, a growing return on capital employed (ROCE) and secondly, an expansion in the company's amount of capital employed. Put simply, these types of businesses are compounding machines, meaning they are continually reinvesting their earnings at ever-higher rates of return. Speaking of which, we noticed some great changes in Huron Consulting Group's (NASDAQ:HURN) returns on capital, so let's have a look.
Return On Capital Employed (ROCE): What Is It?
For those that aren't sure what ROCE is, it measures the amount of pre-tax profits a company can generate from the capital employed in its business. Analysts use this formula to calculate it for Huron Consulting Group:
Return on Capital Employed = Earnings Before Interest and Tax (EBIT) ÷ (Total Assets - Current Liabilities)
0.12 = US$139m ÷ (US$1.3b - US$188m) (Based on the trailing twelve months to March 2024).
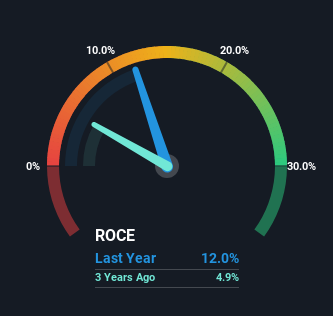
Therefore, Huron Consulting Group has an ROCE of 12%. In absolute terms, that's a pretty normal return, and it's somewhat close to the Professional Services industry average of 14%.
Check out our latest analysis for Huron Consulting Group
In the above chart we have measured Huron Consulting Group's prior ROCE against its prior performance, but the future is arguably more important. If you're interested, you can view the analysts predictions in our free analyst report for Huron Consulting Group .
What Can We Tell From Huron Consulting Group's ROCE Trend?
Huron Consulting Group is displaying some positive trends. Over the last five years, returns on capital employed have risen substantially to 12%. The amount of capital employed has increased too, by 62%. The increasing returns on a growing amount of capital is common amongst multi-baggers and that's why we're impressed.
On a related note, the company's ratio of current liabilities to total assets has decreased to 14%, which basically reduces it's funding from the likes of short-term creditors or suppliers. So shareholders would be pleased that the growth in returns has mostly come from underlying business performance.
What We Can Learn From Huron Consulting Group's ROCE
A company that is growing its returns on capital and can consistently reinvest in itself is a highly sought after trait, and that's what Huron Consulting Group has. Since the stock has returned a solid 92% to shareholders over the last five years, it's fair to say investors are beginning to recognize these changes. So given the stock has proven it has promising trends, it's worth researching the company further to see if these trends are likely to persist.
If you'd like to know more about Huron Consulting Group, we've spotted 2 warning signs, and 1 of them shouldn't be ignored.
If you want to search for solid companies with great earnings, check out this free list of companies with good balance sheets and impressive returns on equity.
Have feedback on this article? Concerned about the content? Get in touch with us directly. Alternatively, email editorial-team (at) simplywallst.com.
This article by Simply Wall St is general in nature. We provide commentary based on historical data and analyst forecasts only using an unbiased methodology and our articles are not intended to be financial advice. It does not constitute a recommendation to buy or sell any stock, and does not take account of your objectives, or your financial situation. We aim to bring you long-term focused analysis driven by fundamental data. Note that our analysis may not factor in the latest price-sensitive company announcements or qualitative material. Simply Wall St has no position in any stocks mentioned.
Have feedback on this article? Concerned about the content? Get in touch with us directly. Alternatively, email editorial-team@simplywallst.com
