
 Yahoo Finance
 IBEX (NASDAQ:IBEX) Is Doing The Right Things To Multiply Its Share Price
There are a few key trends to look for if we want to identify the next multi-bagger. Firstly, we'd want to identify a growing return on capital employed (ROCE) and then alongside that, an ever-increasing base of capital employed. Basically this means that a company has profitable initiatives that it can continue to reinvest in, which is a trait of a compounding machine. So when we looked at IBEX (NASDAQ:IBEX) and its trend of ROCE, we really liked what we saw.
What Is Return On Capital Employed (ROCE)?
For those who don't know, ROCE is a measure of a company's yearly pre-tax profit (its return), relative to the capital employed in the business. Analysts use this formula to calculate it for IBEX:
Return on Capital Employed = Earnings Before Interest and Tax (EBIT) ÷ (Total Assets - Current Liabilities)
0.17 = US$38m ÷ (US$290m - US$71m) (Based on the trailing twelve months to March 2024).
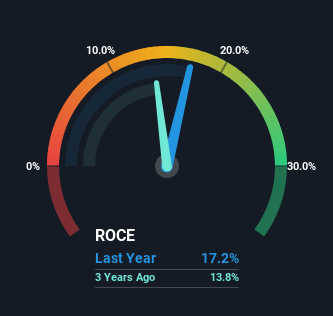
So, IBEX has an ROCE of 17%. On its own, that's a standard return, however it's much better than the 14% generated by the Professional Services industry.
See our latest analysis for IBEX
Above you can see how the current ROCE for IBEX compares to its prior returns on capital, but there's only so much you can tell from the past. If you'd like to see what analysts are forecasting going forward, you should check out our free analyst report for IBEX .
What Can We Tell From IBEX's ROCE Trend?
IBEX is displaying some positive trends. The data shows that returns on capital have increased substantially over the last five years to 17%. The amount of capital employed has increased too, by 222%. The increasing returns on a growing amount of capital is common amongst multi-baggers and that's why we're impressed.
In another part of our analysis, we noticed that the company's ratio of current liabilities to total assets decreased to 24%, which broadly means the business is relying less on its suppliers or short-term creditors to fund its operations. So this improvement in ROCE has come from the business' underlying economics, which is great to see.
Our Take On IBEX's ROCE
In summary, it's great to see that IBEX can compound returns by consistently reinvesting capital at increasing rates of return, because these are some of the key ingredients of those highly sought after multi-baggers. And since the stock has fallen 18% over the last three years, there might be an opportunity here. That being the case, research into the company's current valuation metrics and future prospects seems fitting.
While IBEX looks impressive, no company is worth an infinite price. The intrinsic value infographic for IBEX helps visualize whether it is currently trading for a fair price.
For those who like to invest in solid companies, check out this free list of companies with solid balance sheets and high returns on equity.
Have feedback on this article? Concerned about the content? Get in touch with us directly. Alternatively, email editorial-team (at) simplywallst.com.
This article by Simply Wall St is general in nature. We provide commentary based on historical data and analyst forecasts only using an unbiased methodology and our articles are not intended to be financial advice. It does not constitute a recommendation to buy or sell any stock, and does not take account of your objectives, or your financial situation. We aim to bring you long-term focused analysis driven by fundamental data. Note that our analysis may not factor in the latest price-sensitive company announcements or qualitative material. Simply Wall St has no position in any stocks mentioned.
Have feedback on this article? Concerned about the content? Get in touch with us directly. Alternatively, email editorial-team@simplywallst.com
