
 Yahoo Finance
 Imagine Owning Serial System (SGX:S69) And Wondering If The 45% Share Price Slide Is Justified

As an investor its worth striving to ensure your overall portfolio beats the market average. But the risk of stock picking is that you will likely buy under-performing companies. Unfortunately, that's been the case for longer term Serial System Ltd (SGX:S69) shareholders, since the share price is down 45% in the last three years, falling well short of the market return of around 20%. There was little comfort for shareholders in the last week as the price declined a further 2.6%.
See our latest analysis for Serial System
In his essay The Superinvestors of Graham-and-Doddsville Warren Buffett described how share prices do not always rationally reflect the value of a business. By comparing earnings per share (EPS) and share price changes over time, we can get a feel for how investor attitudes to a company have morphed over time.
Although the share price is down over three years, Serial System actually managed to grow EPS by 70% per year in that time. Given the share price reaction, one might suspect that EPS is not a good guide to the business performance during the period (perhaps due to a one-off loss or gain). Alternatively, growth expectations may have been unreasonable in the past.
It's worth taking a look at other metrics, because the EPS growth doesn't seem to match with the falling share price.
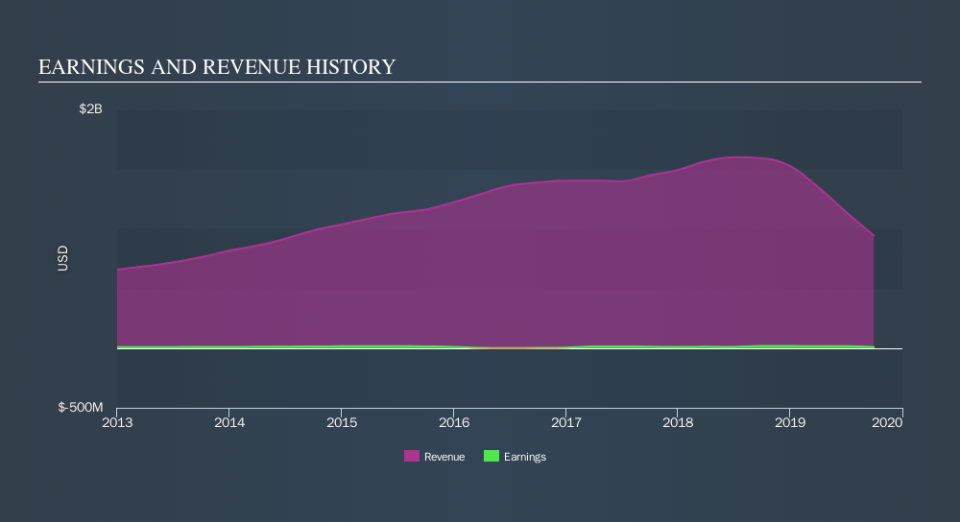
We note that the dividend seems healthy enough, so that probably doesn't explain the share price drop. However, the weak share price might be related to the fact revenue has been disappearing at a rate of 5.3% each year, over three years. In that case, the current EPS might be viewed by some as difficult to sustain.
The company's revenue and earnings (over time) are depicted in the image below (click to see the exact numbers).
You can see how its balance sheet has strengthened (or weakened) over time in this free interactive graphic.
What About Dividends?
It is important to consider the total shareholder return, as well as the share price return, for any given stock. The TSR incorporates the value of any spin-offs or discounted capital raisings, along with any dividends, based on the assumption that the dividends are reinvested. Arguably, the TSR gives a more comprehensive picture of the return generated by a stock. We note that for Serial System the TSR over the last 3 years was -28%, which is better than the share price return mentioned above. This is largely a result of its dividend payments!
A Different Perspective
Investors in Serial System had a tough year, with a total loss of 8.5% (including dividends) , against a market gain of about 8.4%. However, keep in mind that even the best stocks will sometimes underperform the market over a twelve month period. Regrettably, last year's performance caps off a bad run, with the shareholders facing a total loss of 3.7% per year over five years. Generally speaking long term share price weakness can be a bad sign, though contrarian investors might want to research the stock in hope of a turnaround. Importantly, we haven't analysed Serial System's dividend history. This free visual report on its dividends is a must-read if you're thinking of buying.
If you like to buy stocks alongside management, then you might just love this free list of companies. (Hint: insiders have been buying them).
Please note, the market returns quoted in this article reflect the market weighted average returns of stocks that currently trade on SG exchanges.
We aim to bring you long-term focused research analysis driven by fundamental data. Note that our analysis may not factor in the latest price-sensitive company announcements or qualitative material.
If you spot an error that warrants correction, please contact the editor at editorial-team@simplywallst.com. This article by Simply Wall St is general in nature. It does not constitute a recommendation to buy or sell any stock, and does not take account of your objectives, or your financial situation. Simply Wall St has no position in the stocks mentioned. Thank you for reading.
