
 Yahoo Finance
 Imperial Oil (IMO) Shares Dip 1% Since Q2 Earnings Beat
Imperial Oil IMO shares have gone down by 1.1% since its second-quarter earnings announcement on Jul 29.
Despite an earnings beat, IMO’s share price may have fallen as revenues underperformed the Zacks Consensus Estimate by almost 20%.
Behind The Earnings Headlines
Imperial Oil reported second-quarter 2022 adjusted earnings per share of $2.84, beating the Zacks Consensus Estimate of $2.32, largely due to better demand and stronger commodity prices. Moreover, the bottom line improved significantly from the year-ago quarter’s profit of 41 cents due to higher realizations.
The Canadian integrated oil and gas player’s quarterly revenues of $13.56 billion underperformed the Zacks Consensus Estimate of $17 billion. However, the top line rose from the year-ago quarter’s sales of $6.55 billion.
Imperial Oil announced a third-quarter 2022 dividend of 34 Canadian cents per share.
Segmental Information
Upstream: Revenues of C$5,949 million increased from the prior-year level of C$3,934 million. The segment reported a net income of C$1,346 million, more than a net income of C$247 million in the year-ago quarter. This upside was driven by higher realizations and higher volumes as recovery was seen from the cold weather impacts in the first quarter.
Net production volumes during the quarter under review averaged 336,000 barrels of oil equivalent per day (Boe/d), down from 354,000 Boe/d in the year-ago quarter. The total oil and NGL output amounted 397,000 barrels per day (bpd) compared with 382,000 bpd in the second quarter of 2021. Net oil and NGL output from Kearl and Cold Lake totaled 145,000 bpd and 101,000 bpd, respectively. Syncrude output averaged 63,000 bpd, up from the year-earlier level of 38,000 bpd. Net natural gas production came in at 95 million cubic feet per day (Mcf/d), lower than 110 Mcf/d in the comparable quarter of the last year.
Bitumen price realizations totaled C$112.27 a barrel, up from C$57.26 in the year-ago quarter. IMO received an average realized price of C$144.67 per barrel of synthetic oil compared with the year-ago quarter’s C$80.80. For conventional crude oil, it received C$115.80 per barrel compared with the year-ago quarter’s C$58.44. The price of NGL increased to C$69.19 a barrel, while the same for gas rose to C$6.81 per thousand cubic feet.
Downstream: Revenues of C$18,785 million skyrocked from C$5,831 million in the second quarter of 2021. Moreover, the segment earned a net income of C$1,033 million compared with C$60 million in the year-ago quarter, attributable to the substantial increases in Downstream product prices in the reported quarter.
The refinery throughput in the second quarter averaged 412,000 bpd, higher than the prior-year level of 332,000 bpd. The capacity utilization of 96% compared favorably with the year-earlier level of 78%. This outperformance was due to increased demand and higher prices.
Chemical: Revenues of C$563 million rose from C$456 million in the second quarter of 2021. The net income for this segment was recorded at C$53 million, down from C$109 million in the year-ago quarter.
Imperial Oil Limited Price, Consensus and EPS Surprise
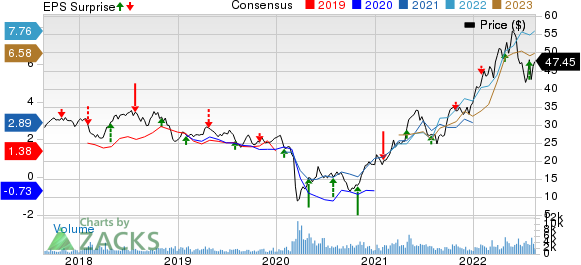
Imperial Oil Limited price-consensus-eps-surprise-chart | Imperial Oil Limited Quote
Total Costs & Capex
Total expenses of C$14,141 million increased from the year-ago quarter’s C$7,576 million.
In the quarter under consideration, Imperial Oil’s capital and exploration expenditures totaled C$314 million, higher than the year-ago quarter’s C$259 million.
Financial Performance
Imperial Oil’s cash flow from operating activities was C$2.68 billion in the reported quarter. However, in the year-ago period, cash flow from the operating activities had come in at C$852 million. Meanwhile, IMO’s free cash flow during the second quarter of 2022 totaled C$2.45 billion.
The company returned C$228 million to its shareholders through dividends in the reported quarter.
As of Jun 30, Imperial Oil held C$2.87 billion in cash and cash equivalents. Its total debt amounted to C$5,166 million.
Outlook
Imperial updated its annual full-year production guidance at Kearl to be around 245,000 total gross barrels per day.
The capital expenditure guidance for the full year has been maintained at around C$1.4 billion.
Zacks Rank & Other Energy Picks
Imperial Oil currently carries a Zacks Rank #3 (Hold). Investors interested in the energy sector might look at ExxonMobil XOM, Equinor ASA EQNR, and Earthstone Energy ESTE, each carrying a Zacks Rank #1 (Strong Buy), currently. You can see the complete list of today’s Zacks #1 Rank stocks here.
ExxonMobil is valued at some $393.3 billion. The Zacks Consensus Estimate for XOM’s 2022 earnings has been revised 21.2% upward over the past 60 days.
ExxonMobil, headquartered in Irving, TX, has a trailing four-quarter earnings surprise of roughly 1.6%, on average.
EQNR is valued at some $119.7 billion. The Zacks Consensus Estimate for EQNR’s 2022 earnings has been revised 11.3% upward over the past 60 days.
Equinor, headquartered in Stavanger, Norway, delivered an 8.3% beat in Q2.
ESTE beat the Zacks Consensus Estimate for earnings in each of the last four quarters. The company has a trailing four-quarter earnings surprise of roughly 27%, on average.
Earthstone Energy is valued at around $2.67 billion.
Want the latest recommendations from Zacks Investment Research? Today, you can download 7 Best Stocks for the Next 30 Days. Click to get this free report
Exxon Mobil Corporation (XOM) : Free Stock Analysis Report
Imperial Oil Limited (IMO) : Free Stock Analysis Report
Earthstone Energy, Inc. (ESTE) : Free Stock Analysis Report
Equinor ASA (EQNR) : Free Stock Analysis Report
To read this article on Zacks.com click here.
Zacks Investment Research
