
 Yahoo Finance
 Inchcape (LON:INCH) Has Some Difficulty Using Its Capital Effectively
What underlying fundamental trends can indicate that a company might be in decline? More often than not, we'll see a declining return on capital employed (ROCE) and a declining amount of capital employed. This indicates the company is producing less profit from its investments and its total assets are decreasing. And from a first read, things don't look too good at Inchcape (LON:INCH), so let's see why.
What is Return On Capital Employed (ROCE)?
For those who don't know, ROCE is a measure of a company's yearly pre-tax profit (its return), relative to the capital employed in the business. Analysts use this formula to calculate it for Inchcape:
Return on Capital Employed = Earnings Before Interest and Tax (EBIT) ÷ (Total Assets - Current Liabilities)
0.16 = UK£297m ÷ (UK£3.6b - UK£1.7b) (Based on the trailing twelve months to June 2021).
Therefore, Inchcape has an ROCE of 16%. That's a pretty standard return and it's in line with the industry average of 16%.
See our latest analysis for Inchcape
Above you can see how the current ROCE for Inchcape compares to its prior returns on capital, but there's only so much you can tell from the past. If you're interested, you can view the analysts predictions in our free report on analyst forecasts for the company.
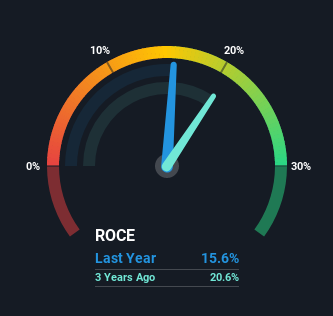
So How Is Inchcape's ROCE Trending?
In terms of Inchcape's historical ROCE movements, the trend doesn't inspire confidence. About five years ago, returns on capital were 20%, however they're now substantially lower than that as we saw above. On top of that, it's worth noting that the amount of capital employed within the business has remained relatively steady. Companies that exhibit these attributes tend to not be shrinking, but they can be mature and facing pressure on their margins from competition. If these trends continue, we wouldn't expect Inchcape to turn into a multi-bagger.
Another thing to note, Inchcape has a high ratio of current liabilities to total assets of 48%. This can bring about some risks because the company is basically operating with a rather large reliance on its suppliers or other sorts of short-term creditors. Ideally we'd like to see this reduce as that would mean fewer obligations bearing risks.
In Conclusion...
In the end, the trend of lower returns on the same amount of capital isn't typically an indication that we're looking at a growth stock. But investors must be expecting an improvement of sorts because over the last five yearsthe stock has delivered a respectable 58% return. In any case, the current underlying trends don't bode well for long term performance so unless they reverse, we'd start looking elsewhere.
On a separate note, we've found 3 warning signs for Inchcape you'll probably want to know about.
For those who like to invest in solid companies, check out this free list of companies with solid balance sheets and high returns on equity.
Have feedback on this article? Concerned about the content? Get in touch with us directly. Alternatively, email editorial-team (at) simplywallst.com.
This article by Simply Wall St is general in nature. We provide commentary based on historical data and analyst forecasts only using an unbiased methodology and our articles are not intended to be financial advice. It does not constitute a recommendation to buy or sell any stock, and does not take account of your objectives, or your financial situation. We aim to bring you long-term focused analysis driven by fundamental data. Note that our analysis may not factor in the latest price-sensitive company announcements or qualitative material. Simply Wall St has no position in any stocks mentioned.
