
 Yahoo Finance
 Institutional investors may adopt severe steps after i3 Energy Plc's (LON:I3E) latest 11% drop adds to a year losses
Key Insights
Significantly high institutional ownership implies i3 Energy's stock price is sensitive to their trading actions
56% of the business is held by the top 5 shareholders
Ownership research, combined with past performance data can help provide a good understanding of opportunities in a stock
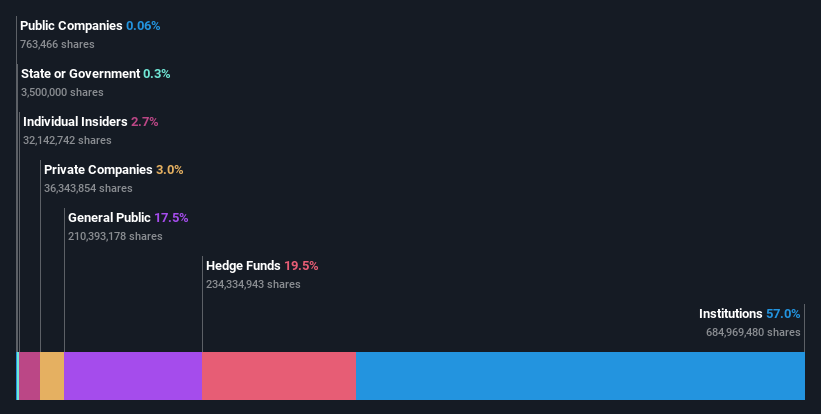
A look at the shareholders of i3 Energy Plc (LON:I3E) can tell us which group is most powerful. And the group that holds the biggest piece of the pie are institutions with 57% ownership. Put another way, the group faces the maximum upside potential (or downside risk).
And institutional investors endured the highest losses after the company's share price fell by 11% last week. This set of investors may especially be concerned about the current loss, which adds to a one-year loss of 52% for shareholders. Institutions or "liquidity providers" control large sums of money and therefore, these types of investors usually have a lot of influence over stock price movements. As a result, if the decline continues, institutional investors may be pressured to sell i3 Energy which might hurt individual investors.
In the chart below, we zoom in on the different ownership groups of i3 Energy.
See our latest analysis for i3 Energy
What Does The Institutional Ownership Tell Us About i3 Energy?
Many institutions measure their performance against an index that approximates the local market. So they usually pay more attention to companies that are included in major indices.
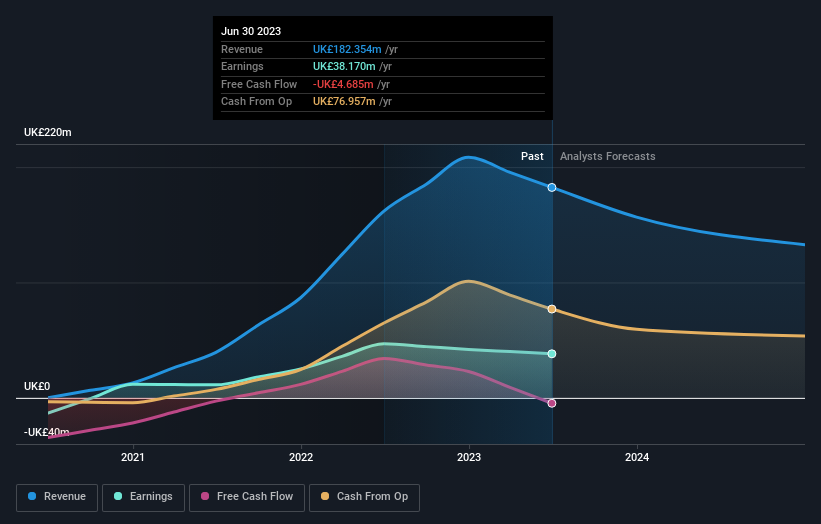
We can see that i3 Energy does have institutional investors; and they hold a good portion of the company's stock. This implies the analysts working for those institutions have looked at the stock and they like it. But just like anyone else, they could be wrong. When multiple institutions own a stock, there's always a risk that they are in a 'crowded trade'. When such a trade goes wrong, multiple parties may compete to sell stock fast. This risk is higher in a company without a history of growth. You can see i3 Energy's historic earnings and revenue below, but keep in mind there's always more to the story.
Institutional investors own over 50% of the company, so together than can probably strongly influence board decisions. Our data indicates that hedge funds own 19% of i3 Energy. That catches my attention because hedge funds sometimes try to influence management, or bring about changes that will create near term value for shareholders. Looking at our data, we can see that the largest shareholder is Polus Capital Management Limited with 19% of shares outstanding. Meanwhile, the second and third largest shareholders, hold 11% and 9.2%, of the shares outstanding, respectively. Additionally, the company's CEO Majid Shafiq directly holds 0.8% of the total shares outstanding.
To make our study more interesting, we found that the top 5 shareholders control more than half of the company which implies that this group has considerable sway over the company's decision-making.
While it makes sense to study institutional ownership data for a company, it also makes sense to study analyst sentiments to know which way the wind is blowing. While there is some analyst coverage, the company is probably not widely covered. So it could gain more attention, down the track.
Insider Ownership Of i3 Energy
While the precise definition of an insider can be subjective, almost everyone considers board members to be insiders. Company management run the business, but the CEO will answer to the board, even if he or she is a member of it.
I generally consider insider ownership to be a good thing. However, on some occasions it makes it more difficult for other shareholders to hold the board accountable for decisions.
We can report that insiders do own shares in i3 Energy Plc. As individuals, the insiders collectively own UK£3.0m worth of the UK£113m company. This shows at least some alignment, but we usually like to see larger insider holdings. You can click here to see if those insiders have been buying or selling.
General Public Ownership
With a 17% ownership, the general public, mostly comprising of individual investors, have some degree of sway over i3 Energy. While this group can't necessarily call the shots, it can certainly have a real influence on how the company is run.
Private Company Ownership
We can see that Private Companies own 3.0%, of the shares on issue. Private companies may be related parties. Sometimes insiders have an interest in a public company through a holding in a private company, rather than in their own capacity as an individual. While it's hard to draw any broad stroke conclusions, it is worth noting as an area for further research.
Next Steps:
It's always worth thinking about the different groups who own shares in a company. But to understand i3 Energy better, we need to consider many other factors. Consider for instance, the ever-present spectre of investment risk. We've identified 2 warning signs with i3 Energy (at least 1 which is potentially serious) , and understanding them should be part of your investment process.
Ultimately the future is most important. You can access this free report on analyst forecasts for the company.
NB: Figures in this article are calculated using data from the last twelve months, which refer to the 12-month period ending on the last date of the month the financial statement is dated. This may not be consistent with full year annual report figures.
Have feedback on this article? Concerned about the content? Get in touch with us directly. Alternatively, email editorial-team (at) simplywallst.com.
This article by Simply Wall St is general in nature. We provide commentary based on historical data and analyst forecasts only using an unbiased methodology and our articles are not intended to be financial advice. It does not constitute a recommendation to buy or sell any stock, and does not take account of your objectives, or your financial situation. We aim to bring you long-term focused analysis driven by fundamental data. Note that our analysis may not factor in the latest price-sensitive company announcements or qualitative material. Simply Wall St has no position in any stocks mentioned.
