
 Yahoo Finance
 Institutions own 48% of Metro Inc. (TSE:MRU) shares but individual investors control 52% of the company
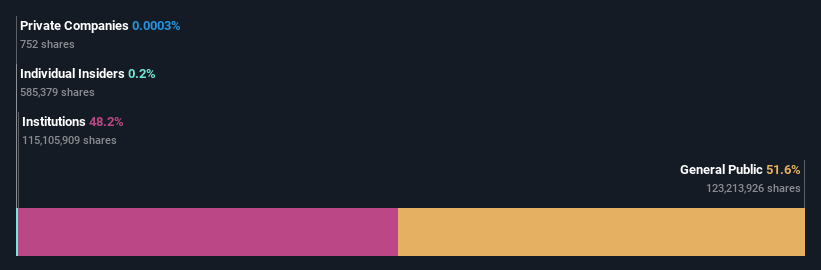
A look at the shareholders of Metro Inc. (TSE:MRU) can tell us which group is most powerful. And the group that holds the biggest piece of the pie are individual investors with 52% ownership. In other words, the group stands to gain the most (or lose the most) from their investment into the company.
Meanwhile, institutions make up 48% of the company’s shareholders. Large companies usually have institutions as shareholders, and we usually see insiders owning shares in smaller companies.
In the chart below, we zoom in on the different ownership groups of Metro.
See our latest analysis for Metro
What Does The Institutional Ownership Tell Us About Metro?
Many institutions measure their performance against an index that approximates the local market. So they usually pay more attention to companies that are included in major indices.
As you can see, institutional investors have a fair amount of stake in Metro. This implies the analysts working for those institutions have looked at the stock and they like it. But just like anyone else, they could be wrong. If multiple institutions change their view on a stock at the same time, you could see the share price drop fast. It's therefore worth looking at Metro's earnings history below. Of course, the future is what really matters.
We note that hedge funds don't have a meaningful investment in Metro. Our data shows that FMR LLC is the largest shareholder with 17% of shares outstanding. With 3.7% and 2.8% of the shares outstanding respectively, The Vanguard Group, Inc. and Fidelity International Ltd are the second and third largest shareholders.
Our studies suggest that the top 25 shareholders collectively control less than half of the company's shares, meaning that the company's shares are widely disseminated and there is no dominant shareholder.
While studying institutional ownership for a company can add value to your research, it is also a good practice to research analyst recommendations to get a deeper understand of a stock's expected performance. Quite a few analysts cover the stock, so you could look into forecast growth quite easily.
Insider Ownership Of Metro
The definition of company insiders can be subjective and does vary between jurisdictions. Our data reflects individual insiders, capturing board members at the very least. Management ultimately answers to the board. However, it is not uncommon for managers to be executive board members, especially if they are a founder or the CEO.
Insider ownership is positive when it signals leadership are thinking like the true owners of the company. However, high insider ownership can also give immense power to a small group within the company. This can be negative in some circumstances.
Our most recent data indicates that insiders own less than 1% of Metro Inc.. It is a very large company, so it would be surprising to see insiders own a large proportion of the company. Though their holding amounts to less than 1%, we can see that board members collectively own CA$41m worth of shares (at current prices). In this sort of situation, it can be more interesting to see if those insiders have been buying or selling.
General Public Ownership
The general public, mostly comprising of individual investors, collectively holds 52% of Metro shares. This level of ownership gives investors from the wider public some power to sway key policy decisions such as board composition, executive compensation, and the dividend payout ratio.
Next Steps:
It's always worth thinking about the different groups who own shares in a company. But to understand Metro better, we need to consider many other factors.
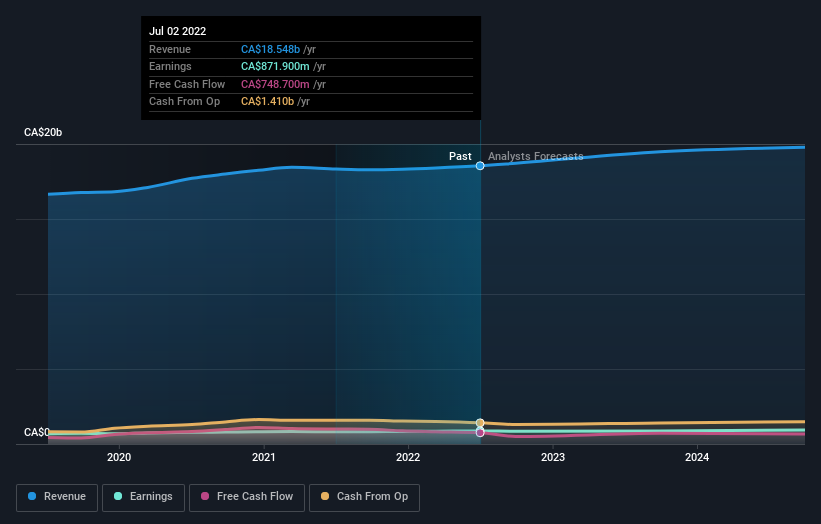
I like to dive deeper into how a company has performed in the past. You can find historic revenue and earnings in this detailed graph.
But ultimately it is the future, not the past, that will determine how well the owners of this business will do. Therefore we think it advisable to take a look at this free report showing whether analysts are predicting a brighter future.
NB: Figures in this article are calculated using data from the last twelve months, which refer to the 12-month period ending on the last date of the month the financial statement is dated. This may not be consistent with full year annual report figures.
Have feedback on this article? Concerned about the content? Get in touch with us directly. Alternatively, email editorial-team (at) simplywallst.com.
This article by Simply Wall St is general in nature. We provide commentary based on historical data and analyst forecasts only using an unbiased methodology and our articles are not intended to be financial advice. It does not constitute a recommendation to buy or sell any stock, and does not take account of your objectives, or your financial situation. We aim to bring you long-term focused analysis driven by fundamental data. Note that our analysis may not factor in the latest price-sensitive company announcements or qualitative material. Simply Wall St has no position in any stocks mentioned.
Join A Paid User Research Session
You’ll receive a US$30 Amazon Gift card for 1 hour of your time while helping us build better investing tools for the individual investors like yourself. Sign up here
