
 Yahoo Finance
 Interested In Thomson Reuters Corporation (TSE:TRI)? Here’s What Its Recent Performance Looks Like

After looking at Thomson Reuters Corporation’s (TSX:TRI) latest earnings announcement (31 March 2018), I found it useful to revisit the company’s performance in the past couple of years and assess this against the most recent figures. As a long-term investor I tend to focus on earnings trend, rather than a single number at one point in time. Also, comparing it against an industry benchmark to understand whether it outperformed, or is simply riding an industry wave, is a crucial aspect. Below is a brief commentary on my key takeaways. See our latest analysis for Thomson Reuters
How TRI fared against its long-term earnings performance and its industry
I like to use data from the most recent 12 months, which either annualizes the most recent 6-month earnings update, or in some cases, the most recent annual report is already the latest available financial data. This method enables me to analyze various companies in a uniform manner using the latest information. For Thomson Reuters, its latest trailing-twelve-month earnings is US$1.41B, which, in comparison to the prior year’s level, has risen by a significant 51.67%. Given that these values are somewhat nearsighted, I’ve determined an annualized five-year value for TRI’s earnings, which stands at US$825.32M This means that, generally, Thomson Reuters has been able to gradually improve its profits over the past few years as well.
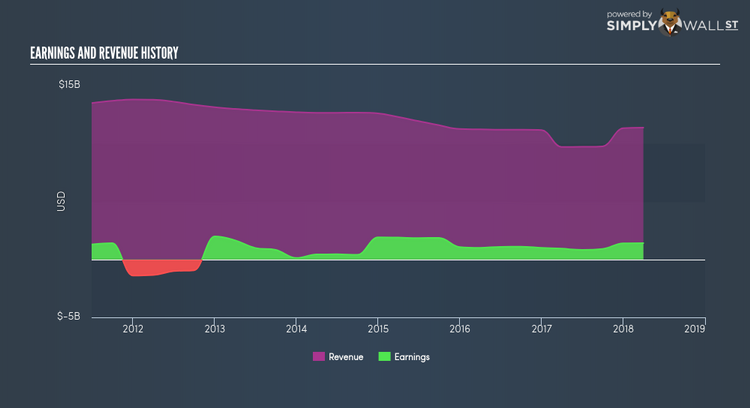
What’s enabled this growth? Let’s take a look at if it is merely owing to industry tailwinds, or if Thomson Reuters has experienced some company-specific growth. In the last couple of years, Thomson Reuters expanded bottom-line, while its top-line fell, by successfully controlling its costs. This brought about to a margin expansion and profitability over time. Inspecting growth from a sector-level, the Canadian capital markets industry has been enduring some headwinds in the past twelve months, leading to an average earnings drop of -4.89%. This is a major change, given that the industry has constantly been delivering a a robust growth of 17.92% in the past five years. This means that any near-term headwind the industry is experiencing, Thomson Reuters is less exposed compared to its peers.
What does this mean?
Thomson Reuters’s track record can be a valuable insight into its earnings performance, but it certainly doesn’t tell the whole story. Positive growth and profitability are what investors like to see in a company’s track record, but how do we properly assess sustainability? I suggest you continue to research Thomson Reuters to get a more holistic view of the stock by looking at:
Future Outlook: What are well-informed industry analysts predicting for TRI’s future growth? Take a look at our free research report of analyst consensus for TRI’s outlook.
Financial Health: Is TRI’s operations financially sustainable? Balance sheets can be hard to analyze, which is why we’ve done it for you. Check out our financial health checks here.
Other High-Performing Stocks: Are there other stocks that provide better prospects with proven track records? Explore our free list of these great stocks here.
NB: Figures in this article are calculated using data from the trailing twelve months from 31 March 2018. This may not be consistent with full year annual report figures.
To help readers see pass the short term volatility of the financial market, we aim to bring you a long-term focused research analysis purely driven by fundamental data. Note that our analysis does not factor in the latest price sensitive company announcements.
The author is an independent contributor and at the time of publication had no position in the stocks mentioned.
