
 Yahoo Finance
 Investing in Ashland (NYSE:ASH) five years ago would have delivered you a 39% gain
The main point of investing for the long term is to make money. Furthermore, you'd generally like to see the share price rise faster than the market. But Ashland Inc. (NYSE:ASH) has fallen short of that second goal, with a share price rise of 29% over five years, which is below the market return. Zooming in, the stock is up a respectable 17% in the last year.
So let's investigate and see if the longer term performance of the company has been in line with the underlying business' progress.
View our latest analysis for Ashland
To paraphrase Benjamin Graham: Over the short term the market is a voting machine, but over the long term it's a weighing machine. One way to examine how market sentiment has changed over time is to look at the interaction between a company's share price and its earnings per share (EPS).
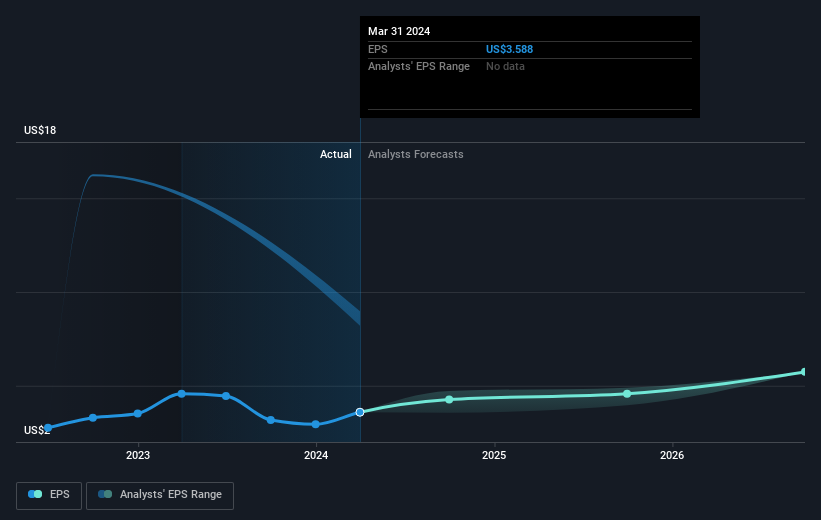
During the last half decade, Ashland became profitable. That would generally be considered a positive, so we'd hope to see the share price to rise. Since the company was unprofitable five years ago, but not three years ago, it's worth taking a look at the returns in the last three years, too. Indeed, the Ashland share price has gained 8.9% in three years. During the same period, EPS grew by 60% each year. This EPS growth is higher than the 2.9% average annual increase in the share price over the same three years. So you might conclude the market is a little more cautious about the stock, these days.
The graphic below depicts how EPS has changed over time (unveil the exact values by clicking on the image).
It is of course excellent to see how Ashland has grown profits over the years, but the future is more important for shareholders. You can see how its balance sheet has strengthened (or weakened) over time in this free interactive graphic.
What About Dividends?
As well as measuring the share price return, investors should also consider the total shareholder return (TSR). The TSR is a return calculation that accounts for the value of cash dividends (assuming that any dividend received was reinvested) and the calculated value of any discounted capital raisings and spin-offs. Arguably, the TSR gives a more comprehensive picture of the return generated by a stock. As it happens, Ashland's TSR for the last 5 years was 39%, which exceeds the share price return mentioned earlier. The dividends paid by the company have thusly boosted the total shareholder return.
A Different Perspective
Ashland shareholders are up 19% for the year (even including dividends). But that was short of the market average. On the bright side, that's still a gain, and it's actually better than the average return of 7% over half a decade This suggests the company might be improving over time. It's always interesting to track share price performance over the longer term. But to understand Ashland better, we need to consider many other factors. To that end, you should be aware of the 2 warning signs we've spotted with Ashland .
If you like to buy stocks alongside management, then you might just love this free list of companies. (Hint: many of them are unnoticed AND have attractive valuation).
Please note, the market returns quoted in this article reflect the market weighted average returns of stocks that currently trade on American exchanges.
Have feedback on this article? Concerned about the content? Get in touch with us directly. Alternatively, email editorial-team (at) simplywallst.com.
This article by Simply Wall St is general in nature. We provide commentary based on historical data and analyst forecasts only using an unbiased methodology and our articles are not intended to be financial advice. It does not constitute a recommendation to buy or sell any stock, and does not take account of your objectives, or your financial situation. We aim to bring you long-term focused analysis driven by fundamental data. Note that our analysis may not factor in the latest price-sensitive company announcements or qualitative material. Simply Wall St has no position in any stocks mentioned.
