
 Yahoo Finance
 Investing in Batu Kawan Berhad (KLSE:BKAWAN) five years ago would have delivered you a 44% gain
Stock pickers are generally looking for stocks that will outperform the broader market. And in our experience, buying the right stocks can give your wealth a significant boost. For example, the Batu Kawan Berhad (KLSE:BKAWAN) share price is up 19% in the last 5 years, clearly besting the market return of around 4.3% (ignoring dividends).
With that in mind, it's worth seeing if the company's underlying fundamentals have been the driver of long term performance, or if there are some discrepancies.
See our latest analysis for Batu Kawan Berhad
There is no denying that markets are sometimes efficient, but prices do not always reflect underlying business performance. One imperfect but simple way to consider how the market perception of a company has shifted is to compare the change in the earnings per share (EPS) with the share price movement.
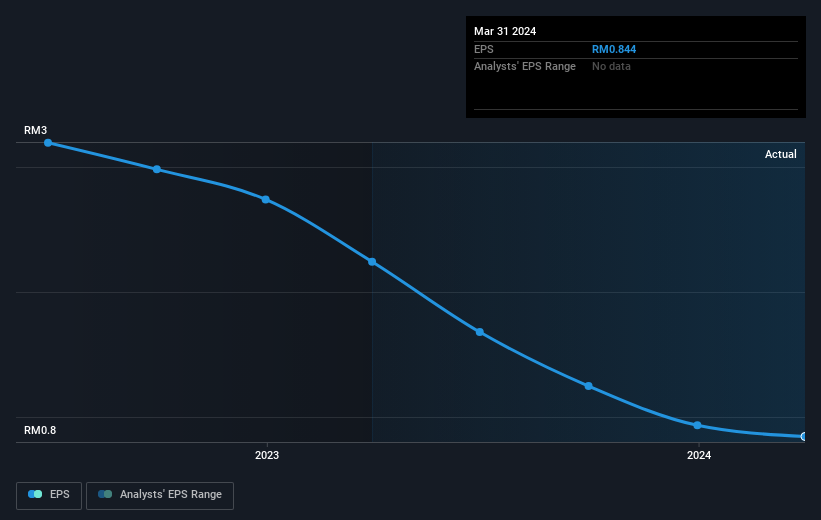
Batu Kawan Berhad's earnings per share are down 3.3% per year, despite strong share price performance over five years.
Since EPS is down a bit, and the share price is up, it's probably that the market previously had some concerns about the company, but the reality has been better than feared. Having said that, if the EPS falls continue we'd be surprised to see a sustained increase in share price.
You can see how EPS has changed over time in the image below (click on the chart to see the exact values).
Dive deeper into Batu Kawan Berhad's key metrics by checking this interactive graph of Batu Kawan Berhad's earnings, revenue and cash flow.
What About Dividends?
It is important to consider the total shareholder return, as well as the share price return, for any given stock. Whereas the share price return only reflects the change in the share price, the TSR includes the value of dividends (assuming they were reinvested) and the benefit of any discounted capital raising or spin-off. So for companies that pay a generous dividend, the TSR is often a lot higher than the share price return. In the case of Batu Kawan Berhad, it has a TSR of 44% for the last 5 years. That exceeds its share price return that we previously mentioned. This is largely a result of its dividend payments!
A Different Perspective
Batu Kawan Berhad shareholders are down 2.4% for the year (even including dividends), but the market itself is up 24%. However, keep in mind that even the best stocks will sometimes underperform the market over a twelve month period. Longer term investors wouldn't be so upset, since they would have made 8%, each year, over five years. It could be that the recent sell-off is an opportunity, so it may be worth checking the fundamental data for signs of a long term growth trend. It's always interesting to track share price performance over the longer term. But to understand Batu Kawan Berhad better, we need to consider many other factors. Even so, be aware that Batu Kawan Berhad is showing 3 warning signs in our investment analysis , and 1 of those makes us a bit uncomfortable...
But note: Batu Kawan Berhad may not be the best stock to buy. So take a peek at this free list of interesting companies with past earnings growth (and further growth forecast).
Please note, the market returns quoted in this article reflect the market weighted average returns of stocks that currently trade on Malaysian exchanges.
Have feedback on this article? Concerned about the content? Get in touch with us directly. Alternatively, email editorial-team (at) simplywallst.com.
This article by Simply Wall St is general in nature. We provide commentary based on historical data and analyst forecasts only using an unbiased methodology and our articles are not intended to be financial advice. It does not constitute a recommendation to buy or sell any stock, and does not take account of your objectives, or your financial situation. We aim to bring you long-term focused analysis driven by fundamental data. Note that our analysis may not factor in the latest price-sensitive company announcements or qualitative material. Simply Wall St has no position in any stocks mentioned.
Have feedback on this article? Concerned about the content? Get in touch with us directly. Alternatively, email editorial-team@simplywallst.com
