
 Yahoo Finance
 Investing in Bright Horizons Family Solutions (NYSE:BFAM) a year ago would have delivered you a 28% gain
Diversification is a key tool for dealing with stock price volatility. But if you're going to beat the market overall, you need to have individual stocks that outperform. One such company is Bright Horizons Family Solutions Inc. (NYSE:BFAM), which saw its share price increase 28% in the last year, slightly above the market return of around 26% (not including dividends). On the other hand, longer term shareholders have had a tougher run, with the stock falling 18% in three years.
With that in mind, it's worth seeing if the company's underlying fundamentals have been the driver of long term performance, or if there are some discrepancies.
See our latest analysis for Bright Horizons Family Solutions
There is no denying that markets are sometimes efficient, but prices do not always reflect underlying business performance. One imperfect but simple way to consider how the market perception of a company has shifted is to compare the change in the earnings per share (EPS) with the share price movement.
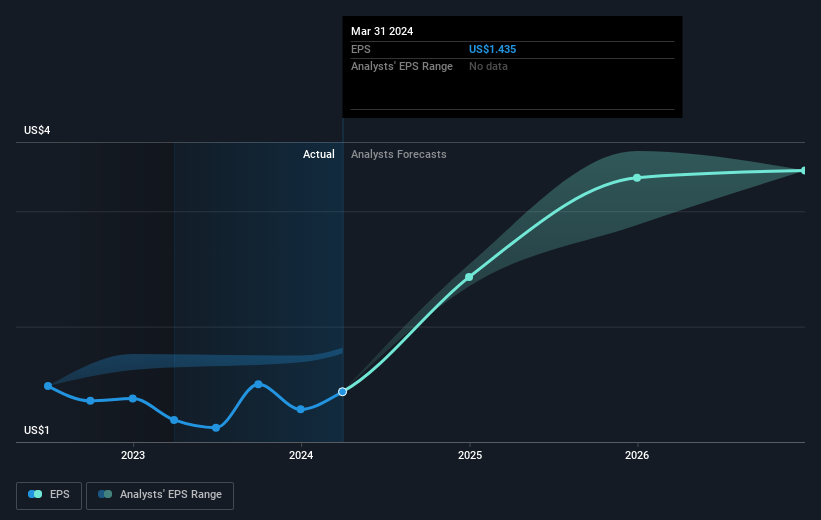
During the last year Bright Horizons Family Solutions grew its earnings per share (EPS) by 20%. The share price gain of 28% certainly outpaced the EPS growth. This indicates that the market is now more optimistic about the stock. This favorable sentiment is reflected in its (fairly optimistic) P/E ratio of 77.40.
The company's earnings per share (over time) is depicted in the image below (click to see the exact numbers).
It's probably worth noting that the CEO is paid less than the median at similar sized companies. But while CEO remuneration is always worth checking, the really important question is whether the company can grow earnings going forward. It might be well worthwhile taking a look at our free report on Bright Horizons Family Solutions' earnings, revenue and cash flow.
A Different Perspective
Bright Horizons Family Solutions provided a TSR of 28% over the year. That's fairly close to the broader market return. To take a positive view, the gain is pleasing, and it sure beats annualized TSR loss of 3%, which was endured over half a decade. We're pretty skeptical of turnaround stories, but it's good to see the recent share price recovery. I find it very interesting to look at share price over the long term as a proxy for business performance. But to truly gain insight, we need to consider other information, too. Consider for instance, the ever-present spectre of investment risk. We've identified 2 warning signs with Bright Horizons Family Solutions , and understanding them should be part of your investment process.
If you would prefer to check out another company -- one with potentially superior financials -- then do not miss this free list of companies that have proven they can grow earnings.
Please note, the market returns quoted in this article reflect the market weighted average returns of stocks that currently trade on American exchanges.
Have feedback on this article? Concerned about the content? Get in touch with us directly. Alternatively, email editorial-team (at) simplywallst.com.
This article by Simply Wall St is general in nature. We provide commentary based on historical data and analyst forecasts only using an unbiased methodology and our articles are not intended to be financial advice. It does not constitute a recommendation to buy or sell any stock, and does not take account of your objectives, or your financial situation. We aim to bring you long-term focused analysis driven by fundamental data. Note that our analysis may not factor in the latest price-sensitive company announcements or qualitative material. Simply Wall St has no position in any stocks mentioned.
