
 Yahoo Finance
 Investing in Hume Cement Industries Berhad (KLSE:HUMEIND) five years ago would have delivered you a 227% gain
The most you can lose on any stock (assuming you don't use leverage) is 100% of your money. But when you pick a company that is really flourishing, you can make more than 100%. Long term Hume Cement Industries Berhad (KLSE:HUMEIND) shareholders would be well aware of this, since the stock is up 218% in five years. Also pleasing for shareholders was the 28% gain in the last three months.
Let's take a look at the underlying fundamentals over the longer term, and see if they've been consistent with shareholders returns.
Check out our latest analysis for Hume Cement Industries Berhad
While the efficient markets hypothesis continues to be taught by some, it has been proven that markets are over-reactive dynamic systems, and investors are not always rational. One flawed but reasonable way to assess how sentiment around a company has changed is to compare the earnings per share (EPS) with the share price.
During the five years of share price growth, Hume Cement Industries Berhad moved from a loss to profitability. That kind of transition can be an inflection point that justifies a strong share price gain, just as we have seen here.
You can see how EPS has changed over time in the image below (click on the chart to see the exact values).
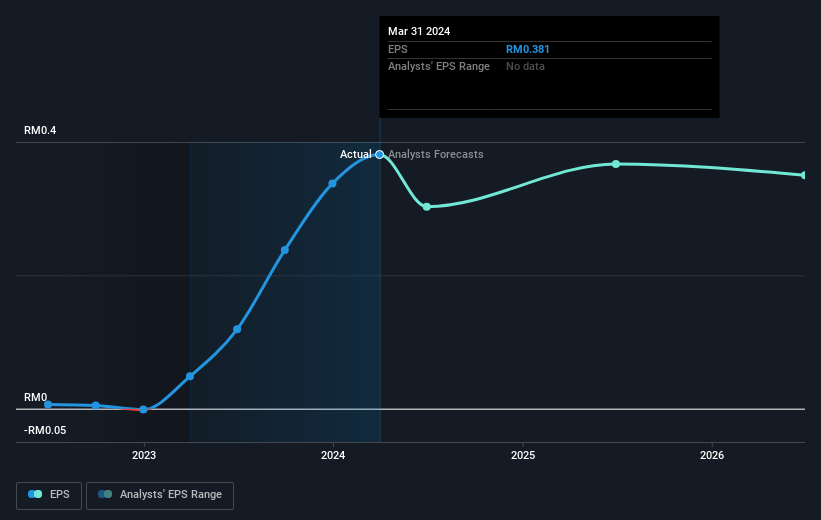
We know that Hume Cement Industries Berhad has improved its bottom line over the last three years, but what does the future have in store? If you are thinking of buying or selling Hume Cement Industries Berhad stock, you should check out this FREE detailed report on its balance sheet.
What About Dividends?
It is important to consider the total shareholder return, as well as the share price return, for any given stock. The TSR incorporates the value of any spin-offs or discounted capital raisings, along with any dividends, based on the assumption that the dividends are reinvested. So for companies that pay a generous dividend, the TSR is often a lot higher than the share price return. We note that for Hume Cement Industries Berhad the TSR over the last 5 years was 227%, which is better than the share price return mentioned above. The dividends paid by the company have thusly boosted the total shareholder return.
A Different Perspective
It's nice to see that Hume Cement Industries Berhad shareholders have received a total shareholder return of 110% over the last year. That's including the dividend. That's better than the annualised return of 27% over half a decade, implying that the company is doing better recently. Someone with an optimistic perspective could view the recent improvement in TSR as indicating that the business itself is getting better with time. It's always interesting to track share price performance over the longer term. But to understand Hume Cement Industries Berhad better, we need to consider many other factors. Take risks, for example - Hume Cement Industries Berhad has 2 warning signs we think you should be aware of.
We will like Hume Cement Industries Berhad better if we see some big insider buys. While we wait, check out this free list of undervalued stocks (mostly small caps) with considerable, recent, insider buying.
Please note, the market returns quoted in this article reflect the market weighted average returns of stocks that currently trade on Malaysian exchanges.
Have feedback on this article? Concerned about the content? Get in touch with us directly. Alternatively, email editorial-team (at) simplywallst.com.
This article by Simply Wall St is general in nature. We provide commentary based on historical data and analyst forecasts only using an unbiased methodology and our articles are not intended to be financial advice. It does not constitute a recommendation to buy or sell any stock, and does not take account of your objectives, or your financial situation. We aim to bring you long-term focused analysis driven by fundamental data. Note that our analysis may not factor in the latest price-sensitive company announcements or qualitative material. Simply Wall St has no position in any stocks mentioned.
Have feedback on this article? Concerned about the content? Get in touch with us directly. Alternatively, email editorial-team@simplywallst.com
