
 Yahoo Finance
 Investing in Intercontinental Exchange (NYSE:ICE) five years ago would have delivered you a 72% gain
The main point of investing for the long term is to make money. Better yet, you'd like to see the share price move up more than the market average. But Intercontinental Exchange, Inc. (NYSE:ICE) has fallen short of that second goal, with a share price rise of 61% over five years, which is below the market return. However, more recent buyers should be happy with the increase of 26% over the last year.
So let's assess the underlying fundamentals over the last 5 years and see if they've moved in lock-step with shareholder returns.
View our latest analysis for Intercontinental Exchange
While markets are a powerful pricing mechanism, share prices reflect investor sentiment, not just underlying business performance. By comparing earnings per share (EPS) and share price changes over time, we can get a feel for how investor attitudes to a company have morphed over time.
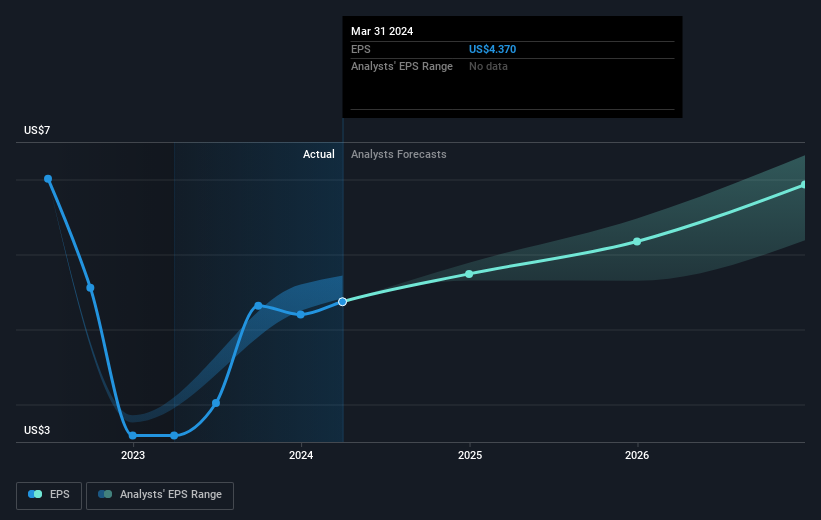
During five years of share price growth, Intercontinental Exchange achieved compound earnings per share (EPS) growth of 4.2% per year. This EPS growth is lower than the 10% average annual increase in the share price. This suggests that market participants hold the company in higher regard, these days. And that's hardly shocking given the track record of growth.
The company's earnings per share (over time) is depicted in the image below (click to see the exact numbers).
We know that Intercontinental Exchange has improved its bottom line lately, but is it going to grow revenue? This free report showing analyst revenue forecasts should help you figure out if the EPS growth can be sustained.
What About Dividends?
It is important to consider the total shareholder return, as well as the share price return, for any given stock. Whereas the share price return only reflects the change in the share price, the TSR includes the value of dividends (assuming they were reinvested) and the benefit of any discounted capital raising or spin-off. So for companies that pay a generous dividend, the TSR is often a lot higher than the share price return. In the case of Intercontinental Exchange, it has a TSR of 72% for the last 5 years. That exceeds its share price return that we previously mentioned. The dividends paid by the company have thusly boosted the total shareholder return.
A Different Perspective
Intercontinental Exchange shareholders have received returns of 28% over twelve months (even including dividends), which isn't far from the general market return. Most would be happy with a gain, and it helps that the year's return is actually better than the average return over five years, which was 11%. Even if the share price growth slows down from here, there's a good chance that this is business worth watching in the long term. It's always interesting to track share price performance over the longer term. But to understand Intercontinental Exchange better, we need to consider many other factors. For instance, we've identified 2 warning signs for Intercontinental Exchange (1 is significant) that you should be aware of.
For those who like to find winning investments this free list of undervalued companies with recent insider purchasing, could be just the ticket.
Please note, the market returns quoted in this article reflect the market weighted average returns of stocks that currently trade on American exchanges.
Have feedback on this article? Concerned about the content? Get in touch with us directly. Alternatively, email editorial-team (at) simplywallst.com.
This article by Simply Wall St is general in nature. We provide commentary based on historical data and analyst forecasts only using an unbiased methodology and our articles are not intended to be financial advice. It does not constitute a recommendation to buy or sell any stock, and does not take account of your objectives, or your financial situation. We aim to bring you long-term focused analysis driven by fundamental data. Note that our analysis may not factor in the latest price-sensitive company announcements or qualitative material. Simply Wall St has no position in any stocks mentioned.
Have feedback on this article? Concerned about the content? Get in touch with us directly. Alternatively, email editorial-team@simplywallst.com
