
 Yahoo Finance
 Investor Optimism Abounds Goodfood Market Corp. (TSE:FOOD) But Growth Is Lacking
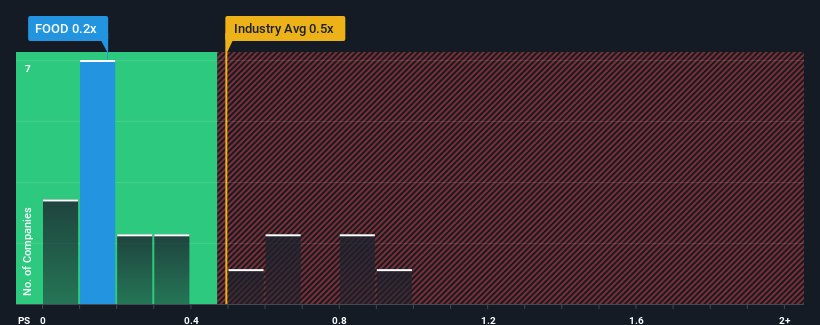
With a median price-to-sales (or "P/S") ratio of close to 0.4x in the Consumer Retailing industry in Canada, you could be forgiven for feeling indifferent about Goodfood Market Corp.'s (TSE:FOOD) P/S ratio of 0.2x. While this might not raise any eyebrows, if the P/S ratio is not justified investors could be missing out on a potential opportunity or ignoring looming disappointment.
View our latest analysis for Goodfood Market
How Has Goodfood Market Performed Recently?
Goodfood Market could be doing better as its revenue has been going backwards lately while most other companies have been seeing positive revenue growth. One possibility is that the P/S ratio is moderate because investors think this poor revenue performance will turn around. However, if this isn't the case, investors might get caught out paying too much for the stock.
Keen to find out how analysts think Goodfood Market's future stacks up against the industry? In that case, our free report is a great place to start.
What Are Revenue Growth Metrics Telling Us About The P/S?
There's an inherent assumption that a company should be matching the industry for P/S ratios like Goodfood Market's to be considered reasonable.
Retrospectively, the last year delivered a frustrating 39% decrease to the company's top line. The last three years don't look nice either as the company has shrunk revenue by 1.7% in aggregate. Accordingly, shareholders would have felt downbeat about the medium-term rates of revenue growth.
Looking ahead now, revenue is anticipated to slump, contracting by 16% during the coming year according to the three analysts following the company. Meanwhile, the broader industry is forecast to expand by 0.7%, which paints a poor picture.
With this in consideration, we think it doesn't make sense that Goodfood Market's P/S is closely matching its industry peers. It seems most investors are hoping for a turnaround in the company's business prospects, but the analyst cohort is not so confident this will happen. Only the boldest would assume these prices are sustainable as these declining revenues are likely to weigh on the share price eventually.
The Final Word
Typically, we'd caution against reading too much into price-to-sales ratios when settling on investment decisions, though it can reveal plenty about what other market participants think about the company.
Our check of Goodfood Market's analyst forecasts revealed that its outlook for shrinking revenue isn't bringing down its P/S as much as we would have predicted. When we see a gloomy outlook like this, our immediate thoughts are that the share price is at risk of declining, negatively impacting P/S. If we consider the revenue outlook, the P/S seems to indicate that potential investors may be paying a premium for the stock.
It's always necessary to consider the ever-present spectre of investment risk. We've identified 5 warning signs with Goodfood Market (at least 1 which is concerning), and understanding them should be part of your investment process.
If strong companies turning a profit tickle your fancy, then you'll want to check out this free list of interesting companies that trade on a low P/E (but have proven they can grow earnings).
Have feedback on this article? Concerned about the content? Get in touch with us directly. Alternatively, email editorial-team (at) simplywallst.com.
This article by Simply Wall St is general in nature. We provide commentary based on historical data and analyst forecasts only using an unbiased methodology and our articles are not intended to be financial advice. It does not constitute a recommendation to buy or sell any stock, and does not take account of your objectives, or your financial situation. We aim to bring you long-term focused analysis driven by fundamental data. Note that our analysis may not factor in the latest price-sensitive company announcements or qualitative material. Simply Wall St has no position in any stocks mentioned.
Join A Paid User Research Session
You’ll receive a US$30 Amazon Gift card for 1 hour of your time while helping us build better investing tools for the individual investors like yourself. Sign up here
