
 Yahoo Finance
 Investors Could Be Concerned With PEC's (SGX:IX2) Returns On Capital
If we're looking to avoid a business that is in decline, what are the trends that can warn us ahead of time? Typically, we'll see the trend of both return on capital employed (ROCE) declining and this usually coincides with a decreasing amount of capital employed. This reveals that the company isn't compounding shareholder wealth because returns are falling and its net asset base is shrinking. Having said that, after a brief look, PEC (SGX:IX2) we aren't filled with optimism, but let's investigate further.
What Is Return On Capital Employed (ROCE)?
For those that aren't sure what ROCE is, it measures the amount of pre-tax profits a company can generate from the capital employed in its business. To calculate this metric for PEC, this is the formula:
Return on Capital Employed = Earnings Before Interest and Tax (EBIT) ÷ (Total Assets - Current Liabilities)
0.036 = S$10m ÷ (S$411m - S$126m) (Based on the trailing twelve months to June 2023).
Therefore, PEC has an ROCE of 3.6%. Even though it's in line with the industry average of 3.6%, it's still a low return by itself.
See our latest analysis for PEC
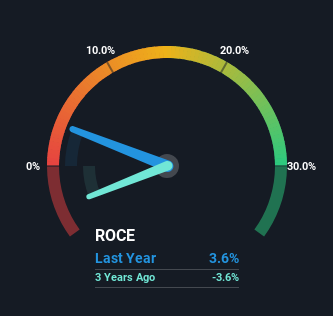
Historical performance is a great place to start when researching a stock so above you can see the gauge for PEC's ROCE against it's prior returns. If you're interested in investigating PEC's past further, check out this free graph of past earnings, revenue and cash flow.
The Trend Of ROCE
We are a bit worried about the trend of returns on capital at PEC. About five years ago, returns on capital were 5.2%, however they're now substantially lower than that as we saw above. And on the capital employed front, the business is utilizing roughly the same amount of capital as it was back then. Companies that exhibit these attributes tend to not be shrinking, but they can be mature and facing pressure on their margins from competition. If these trends continue, we wouldn't expect PEC to turn into a multi-bagger.
The Bottom Line
All in all, the lower returns from the same amount of capital employed aren't exactly signs of a compounding machine. Despite the concerning underlying trends, the stock has actually gained 17% over the last five years, so it might be that the investors are expecting the trends to reverse. Regardless, we don't like the trends as they are and if they persist, we think you might find better investments elsewhere.
Like most companies, PEC does come with some risks, and we've found 2 warning signs that you should be aware of.
If you want to search for solid companies with great earnings, check out this free list of companies with good balance sheets and impressive returns on equity.
Have feedback on this article? Concerned about the content? Get in touch with us directly. Alternatively, email editorial-team (at) simplywallst.com.
This article by Simply Wall St is general in nature. We provide commentary based on historical data and analyst forecasts only using an unbiased methodology and our articles are not intended to be financial advice. It does not constitute a recommendation to buy or sell any stock, and does not take account of your objectives, or your financial situation. We aim to bring you long-term focused analysis driven by fundamental data. Note that our analysis may not factor in the latest price-sensitive company announcements or qualitative material. Simply Wall St has no position in any stocks mentioned.
