
 Yahoo Finance
 Investors Could Be Concerned With VerticalScope Holdings' (TSE:FORA) Returns On Capital
Did you know there are some financial metrics that can provide clues of a potential multi-bagger? Ideally, a business will show two trends; firstly a growing return on capital employed (ROCE) and secondly, an increasing amount of capital employed. Basically this means that a company has profitable initiatives that it can continue to reinvest in, which is a trait of a compounding machine. In light of that, when we looked at VerticalScope Holdings (TSE:FORA) and its ROCE trend, we weren't exactly thrilled.
Return On Capital Employed (ROCE): What Is It?
For those that aren't sure what ROCE is, it measures the amount of pre-tax profits a company can generate from the capital employed in its business. Analysts use this formula to calculate it for VerticalScope Holdings:
Return on Capital Employed = Earnings Before Interest and Tax (EBIT) ÷ (Total Assets - Current Liabilities)
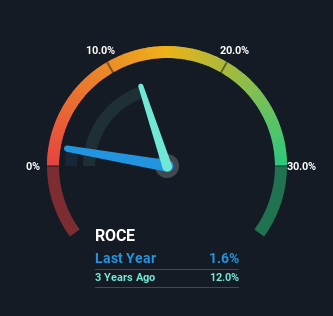
0.016 = US$2.2m ÷ (US$146m - US$11m) (Based on the trailing twelve months to March 2024).
Thus, VerticalScope Holdings has an ROCE of 1.6%. In absolute terms, that's a low return and it also under-performs the Interactive Media and Services industry average of 6.4%.
See our latest analysis for VerticalScope Holdings
In the above chart we have measured VerticalScope Holdings' prior ROCE against its prior performance, but the future is arguably more important. If you'd like to see what analysts are forecasting going forward, you should check out our free analyst report for VerticalScope Holdings .
What Can We Tell From VerticalScope Holdings' ROCE Trend?
When we looked at the ROCE trend at VerticalScope Holdings, we didn't gain much confidence. To be more specific, ROCE has fallen from 3.1% over the last four years. And considering revenue has dropped while employing more capital, we'd be cautious. This could mean that the business is losing its competitive advantage or market share, because while more money is being put into ventures, it's actually producing a lower return - "less bang for their buck" per se.
On a related note, VerticalScope Holdings has decreased its current liabilities to 7.5% of total assets. So we could link some of this to the decrease in ROCE. What's more, this can reduce some aspects of risk to the business because now the company's suppliers or short-term creditors are funding less of its operations. Some would claim this reduces the business' efficiency at generating ROCE since it is now funding more of the operations with its own money.
Our Take On VerticalScope Holdings' ROCE
From the above analysis, we find it rather worrisome that returns on capital and sales for VerticalScope Holdings have fallen, meanwhile the business is employing more capital than it was four years ago. Investors haven't taken kindly to these developments, since the stock has declined 63% from where it was three years ago. With underlying trends that aren't great in these areas, we'd consider looking elsewhere.
VerticalScope Holdings could be trading at an attractive price in other respects, so you might find our free intrinsic value estimation for FORA on our platform quite valuable.
For those who like to invest in solid companies, check out this free list of companies with solid balance sheets and high returns on equity.
Have feedback on this article? Concerned about the content? Get in touch with us directly. Alternatively, email editorial-team (at) simplywallst.com.
This article by Simply Wall St is general in nature. We provide commentary based on historical data and analyst forecasts only using an unbiased methodology and our articles are not intended to be financial advice. It does not constitute a recommendation to buy or sell any stock, and does not take account of your objectives, or your financial situation. We aim to bring you long-term focused analysis driven by fundamental data. Note that our analysis may not factor in the latest price-sensitive company announcements or qualitative material. Simply Wall St has no position in any stocks mentioned.
Have feedback on this article? Concerned about the content? Get in touch with us directly. Alternatively, email editorial-team@simplywallst.com
