
 Yahoo Finance
 Investors in Everyman Media Group (LON:EMAN) have unfortunately lost 71% over the last five years
Long term investing works well, but it doesn't always work for each individual stock. We really hate to see fellow investors lose their hard-earned money. Anyone who held Everyman Media Group plc (LON:EMAN) for five years would be nursing their metaphorical wounds since the share price dropped 71% in that time. We also note that the stock has performed poorly over the last year, with the share price down 39%.
So let's have a look and see if the longer term performance of the company has been in line with the underlying business' progress.
Check out our latest analysis for Everyman Media Group
Given that Everyman Media Group didn't make a profit in the last twelve months, we'll focus on revenue growth to form a quick view of its business development. Generally speaking, companies without profits are expected to grow revenue every year, and at a good clip. That's because it's hard to be confident a company will be sustainable if revenue growth is negligible, and it never makes a profit.
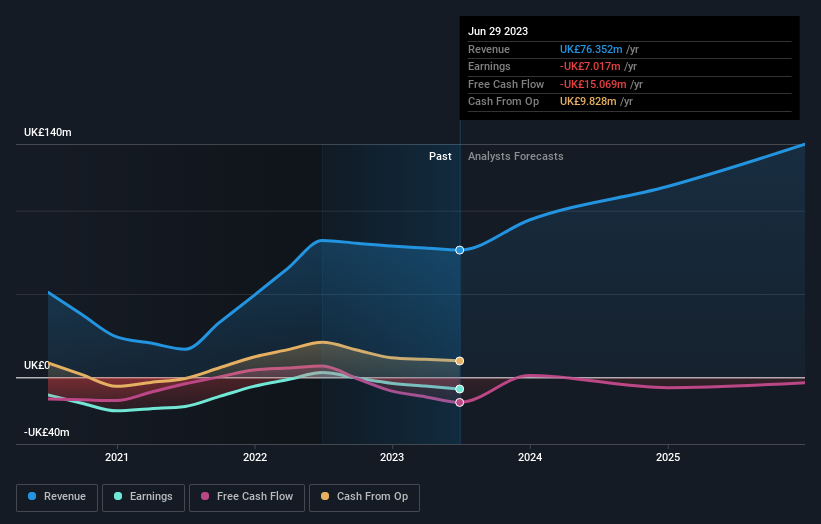
In the last half decade, Everyman Media Group saw its revenue increase by 8.8% per year. That's a fairly respectable growth rate. So the stock price fall of 11% per year seems pretty steep. The market can be a harsh master when your company is losing money and revenue growth disappoints.
The image below shows how earnings and revenue have tracked over time (if you click on the image you can see greater detail).
You can see how its balance sheet has strengthened (or weakened) over time in this free interactive graphic.
A Different Perspective
Investors in Everyman Media Group had a tough year, with a total loss of 39%, against a market gain of about 0.6%. However, keep in mind that even the best stocks will sometimes underperform the market over a twelve month period. Unfortunately, last year's performance may indicate unresolved challenges, given that it was worse than the annualised loss of 11% over the last half decade. Generally speaking long term share price weakness can be a bad sign, though contrarian investors might want to research the stock in hope of a turnaround. It's always interesting to track share price performance over the longer term. But to understand Everyman Media Group better, we need to consider many other factors. Like risks, for instance. Every company has them, and we've spotted 3 warning signs for Everyman Media Group (of which 2 are concerning!) you should know about.
But note: Everyman Media Group may not be the best stock to buy. So take a peek at this free list of interesting companies with past earnings growth (and further growth forecast).
Please note, the market returns quoted in this article reflect the market weighted average returns of stocks that currently trade on British exchanges.
Have feedback on this article? Concerned about the content? Get in touch with us directly. Alternatively, email editorial-team (at) simplywallst.com.
This article by Simply Wall St is general in nature. We provide commentary based on historical data and analyst forecasts only using an unbiased methodology and our articles are not intended to be financial advice. It does not constitute a recommendation to buy or sell any stock, and does not take account of your objectives, or your financial situation. We aim to bring you long-term focused analysis driven by fundamental data. Note that our analysis may not factor in the latest price-sensitive company announcements or qualitative material. Simply Wall St has no position in any stocks mentioned.
