
 Yahoo Finance
 Investors in FirstEnergy (NYSE:FE) have seen returns of 8.6% over the past five years
Ideally, your overall portfolio should beat the market average. But even the best stock picker will only win with some selections. So we wouldn't blame long term FirstEnergy Corp. (NYSE:FE) shareholders for doubting their decision to hold, with the stock down 12% over a half decade.
Since shareholders are down over the longer term, lets look at the underlying fundamentals over the that time and see if they've been consistent with returns.
View our latest analysis for FirstEnergy
To quote Buffett, 'Ships will sail around the world but the Flat Earth Society will flourish. There will continue to be wide discrepancies between price and value in the marketplace...' One way to examine how market sentiment has changed over time is to look at the interaction between a company's share price and its earnings per share (EPS).
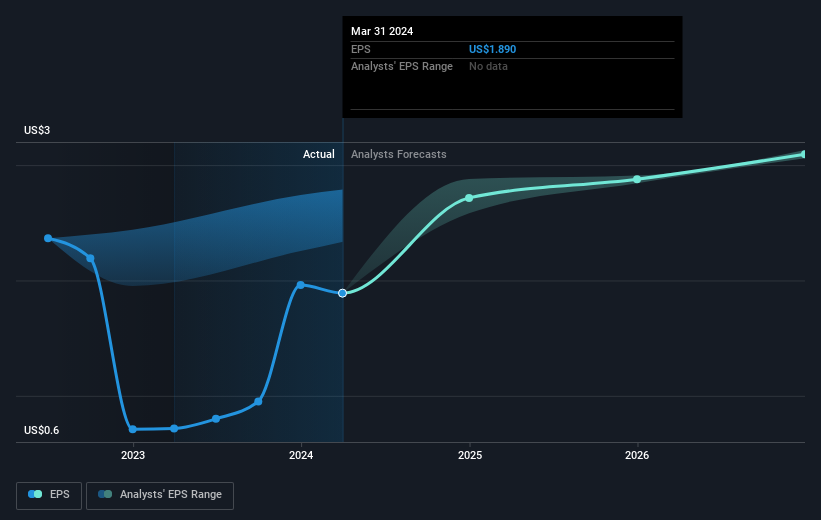
Looking back five years, both FirstEnergy's share price and EPS declined; the latter at a rate of 0.2% per year. Readers should note that the share price has fallen faster than the EPS, at a rate of 2% per year, over the period. So it seems the market was too confident about the business, in the past.
You can see below how EPS has changed over time (discover the exact values by clicking on the image).
We know that FirstEnergy has improved its bottom line lately, but is it going to grow revenue? You could check out this free report showing analyst revenue forecasts.
What About Dividends?
It is important to consider the total shareholder return, as well as the share price return, for any given stock. Whereas the share price return only reflects the change in the share price, the TSR includes the value of dividends (assuming they were reinvested) and the benefit of any discounted capital raising or spin-off. Arguably, the TSR gives a more comprehensive picture of the return generated by a stock. As it happens, FirstEnergy's TSR for the last 5 years was 8.6%, which exceeds the share price return mentioned earlier. And there's no prize for guessing that the dividend payments largely explain the divergence!
A Different Perspective
FirstEnergy shareholders are up 3.2% for the year (even including dividends). But that return falls short of the market. On the bright side, that's still a gain, and it's actually better than the average return of 1.7% over half a decade This could indicate that the company is winning over new investors, as it pursues its strategy. I find it very interesting to look at share price over the long term as a proxy for business performance. But to truly gain insight, we need to consider other information, too. Case in point: We've spotted 2 warning signs for FirstEnergy you should be aware of, and 1 of them can't be ignored.
Of course, you might find a fantastic investment by looking elsewhere. So take a peek at this free list of companies we expect will grow earnings.
Please note, the market returns quoted in this article reflect the market weighted average returns of stocks that currently trade on American exchanges.
Have feedback on this article? Concerned about the content? Get in touch with us directly. Alternatively, email editorial-team (at) simplywallst.com.
This article by Simply Wall St is general in nature. We provide commentary based on historical data and analyst forecasts only using an unbiased methodology and our articles are not intended to be financial advice. It does not constitute a recommendation to buy or sell any stock, and does not take account of your objectives, or your financial situation. We aim to bring you long-term focused analysis driven by fundamental data. Note that our analysis may not factor in the latest price-sensitive company announcements or qualitative material. Simply Wall St has no position in any stocks mentioned.
Have feedback on this article? Concerned about the content? Get in touch with us directly. Alternatively, email editorial-team@simplywallst.com
