
 Yahoo Finance
 Investors five-year losses continue as Alibaba Group Holding (NYSE:BABA) dips a further 3.9% this week, earnings continue to decline
Statistically speaking, long term investing is a profitable endeavour. But no-one is immune from buying too high. For example, after five long years the Alibaba Group Holding Limited (NYSE:BABA) share price is a whole 63% lower. We certainly feel for shareholders who bought near the top. And it's not just long term holders hurting, because the stock is down 60% in the last year. The falls have accelerated recently, with the share price down 32% in the last three months.
Since Alibaba Group Holding has shed CN¥7.3b from its value in the past 7 days, let's see if the longer term decline has been driven by the business' economics.
Check out our latest analysis for Alibaba Group Holding
While markets are a powerful pricing mechanism, share prices reflect investor sentiment, not just underlying business performance. One flawed but reasonable way to assess how sentiment around a company has changed is to compare the earnings per share (EPS) with the share price.
During the five years over which the share price declined, Alibaba Group Holding's earnings per share (EPS) dropped by 5.9% each year. This reduction in EPS is less than the 18% annual reduction in the share price. So it seems the market was too confident about the business, in the past.
You can see below how EPS has changed over time (discover the exact values by clicking on the image).
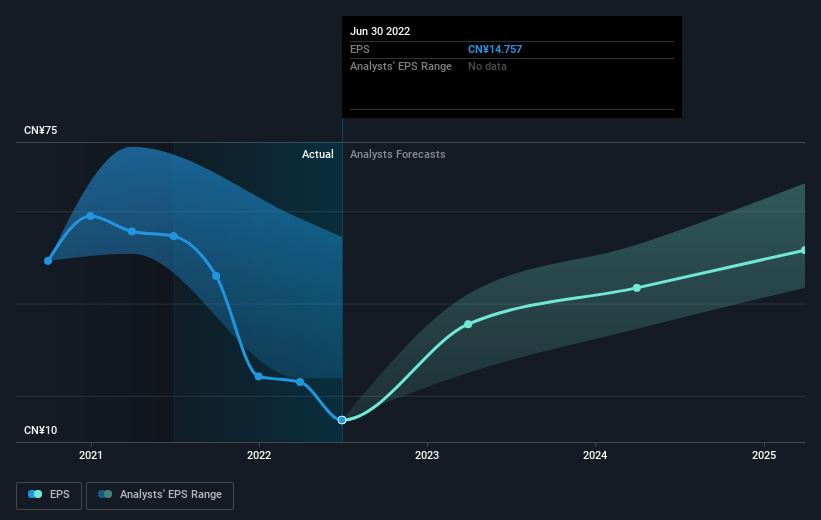
This free interactive report on Alibaba Group Holding's earnings, revenue and cash flow is a great place to start, if you want to investigate the stock further.
A Different Perspective
We regret to report that Alibaba Group Holding shareholders are down 60% for the year. Unfortunately, that's worse than the broader market decline of 21%. However, it could simply be that the share price has been impacted by broader market jitters. It might be worth keeping an eye on the fundamentals, in case there's a good opportunity. Regrettably, last year's performance caps off a bad run, with the shareholders facing a total loss of 10% per year over five years. Generally speaking long term share price weakness can be a bad sign, though contrarian investors might want to research the stock in hope of a turnaround. While it is well worth considering the different impacts that market conditions can have on the share price, there are other factors that are even more important. Consider risks, for instance. Every company has them, and we've spotted 2 warning signs for Alibaba Group Holding you should know about.
If you are like me, then you will not want to miss this free list of growing companies that insiders are buying.
Please note, the market returns quoted in this article reflect the market weighted average returns of stocks that currently trade on US exchanges.
Have feedback on this article? Concerned about the content? Get in touch with us directly. Alternatively, email editorial-team (at) simplywallst.com.
This article by Simply Wall St is general in nature. We provide commentary based on historical data and analyst forecasts only using an unbiased methodology and our articles are not intended to be financial advice. It does not constitute a recommendation to buy or sell any stock, and does not take account of your objectives, or your financial situation. We aim to bring you long-term focused analysis driven by fundamental data. Note that our analysis may not factor in the latest price-sensitive company announcements or qualitative material. Simply Wall St has no position in any stocks mentioned.
Join A Paid User Research Session
You’ll receive a US$30 Amazon Gift card for 1 hour of your time while helping us build better investing tools for the individual investors like yourself. Sign up here
