
 Yahoo Finance
 Investors in Gama Aviation (LON:GMAA) have seen impressive returns of 143% over the past three years
It might seem bad, but the worst that can happen when you buy a stock (without leverage) is that its share price goes to zero. But if you buy shares in a really great company, you can more than double your money. To wit, the Gama Aviation Plc (LON:GMAA) share price has flown 143% in the last three years. How nice for those who held the stock!
With that in mind, it's worth seeing if the company's underlying fundamentals have been the driver of long term performance, or if there are some discrepancies.
See our latest analysis for Gama Aviation
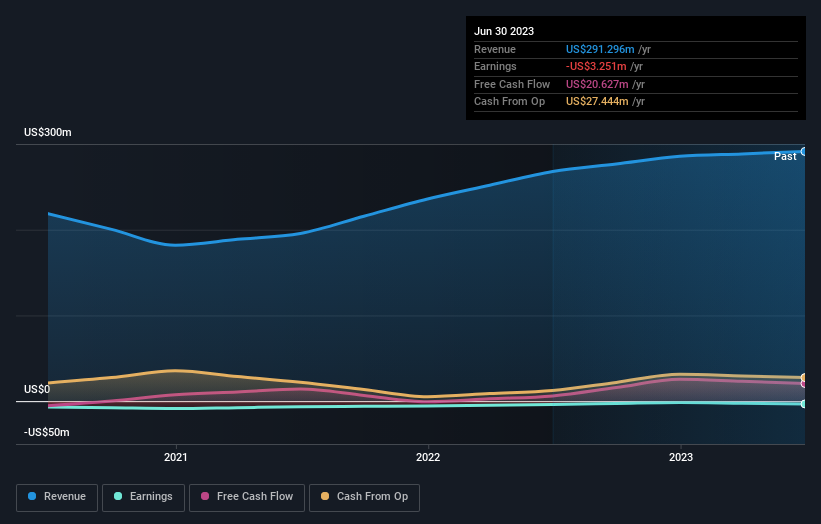
Given that Gama Aviation didn't make a profit in the last twelve months, we'll focus on revenue growth to form a quick view of its business development. When a company doesn't make profits, we'd generally hope to see good revenue growth. That's because it's hard to be confident a company will be sustainable if revenue growth is negligible, and it never makes a profit.
Over the last three years Gama Aviation has grown its revenue at 16% annually. That's a very respectable growth rate. Broadly speaking, this solid progress may well be reflected by the healthy share price gain of 34% per year over three years. It's hard to value pre-profit businesses, but it seems like the market has become a lot more optimistic about this one! It would be worth thinking about when profits will flow, since that milestone will attract more attention.
The graphic below depicts how earnings and revenue have changed over time (unveil the exact values by clicking on the image).
You can see how its balance sheet has strengthened (or weakened) over time in this free interactive graphic.
A Different Perspective
We're pleased to report that Gama Aviation shareholders have received a total shareholder return of 45% over one year. That gain is better than the annual TSR over five years, which is 9%. Therefore it seems like sentiment around the company has been positive lately. Someone with an optimistic perspective could view the recent improvement in TSR as indicating that the business itself is getting better with time. I find it very interesting to look at share price over the long term as a proxy for business performance. But to truly gain insight, we need to consider other information, too. Consider for instance, the ever-present spectre of investment risk. We've identified 2 warning signs with Gama Aviation (at least 1 which is significant) , and understanding them should be part of your investment process.
Of course, you might find a fantastic investment by looking elsewhere. So take a peek at this free list of companies we expect will grow earnings.
Please note, the market returns quoted in this article reflect the market weighted average returns of stocks that currently trade on British exchanges.
Have feedback on this article? Concerned about the content? Get in touch with us directly. Alternatively, email editorial-team (at) simplywallst.com.
This article by Simply Wall St is general in nature. We provide commentary based on historical data and analyst forecasts only using an unbiased methodology and our articles are not intended to be financial advice. It does not constitute a recommendation to buy or sell any stock, and does not take account of your objectives, or your financial situation. We aim to bring you long-term focused analysis driven by fundamental data. Note that our analysis may not factor in the latest price-sensitive company announcements or qualitative material. Simply Wall St has no position in any stocks mentioned.
