
 Yahoo Finance
 Investors in Jubilee Metals Group (LON:JLP) have made a solid return of 199% over the past five years
The most you can lose on any stock (assuming you don't use leverage) is 100% of your money. But when you pick a company that is really flourishing, you can make more than 100%. Long term Jubilee Metals Group PLC (LON:JLP) shareholders would be well aware of this, since the stock is up 199% in five years. It's down 2.4% in the last seven days.
So let's assess the underlying fundamentals over the last 5 years and see if they've moved in lock-step with shareholder returns.
See our latest analysis for Jubilee Metals Group
While markets are a powerful pricing mechanism, share prices reflect investor sentiment, not just underlying business performance. By comparing earnings per share (EPS) and share price changes over time, we can get a feel for how investor attitudes to a company have morphed over time.
During the last half decade, Jubilee Metals Group became profitable. Sometimes, the start of profitability is a major inflection point that can signal fast earnings growth to come, which in turn justifies very strong share price gains. Given that the company made a profit three years ago, but not five years ago, it is worth looking at the share price returns over the last three years, too. Indeed, the Jubilee Metals Group share price has gained 152% in three years. During the same period, EPS grew by 12% each year. Notably, the EPS growth has been slower than the annualised share price gain of 36% over three years. So it's fair to assume the market has a higher opinion of the business than it did three years ago.
The graphic below depicts how EPS has changed over time (unveil the exact values by clicking on the image).
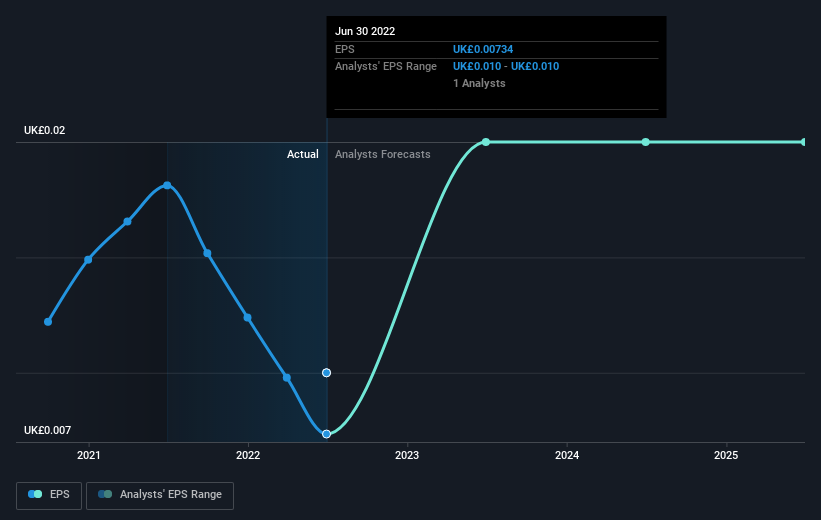
It might be well worthwhile taking a look at our free report on Jubilee Metals Group's earnings, revenue and cash flow.
A Different Perspective
We regret to report that Jubilee Metals Group shareholders are down 31% for the year. Unfortunately, that's worse than the broader market decline of 3.3%. However, it could simply be that the share price has been impacted by broader market jitters. It might be worth keeping an eye on the fundamentals, in case there's a good opportunity. On the bright side, long term shareholders have made money, with a gain of 25% per year over half a decade. If the fundamental data continues to indicate long term sustainable growth, the current sell-off could be an opportunity worth considering. It's always interesting to track share price performance over the longer term. But to understand Jubilee Metals Group better, we need to consider many other factors. For example, we've discovered 4 warning signs for Jubilee Metals Group (1 makes us a bit uncomfortable!) that you should be aware of before investing here.
But note: Jubilee Metals Group may not be the best stock to buy. So take a peek at this free list of interesting companies with past earnings growth (and further growth forecast).
Please note, the market returns quoted in this article reflect the market weighted average returns of stocks that currently trade on GB exchanges.
Have feedback on this article? Concerned about the content? Get in touch with us directly. Alternatively, email editorial-team (at) simplywallst.com.
This article by Simply Wall St is general in nature. We provide commentary based on historical data and analyst forecasts only using an unbiased methodology and our articles are not intended to be financial advice. It does not constitute a recommendation to buy or sell any stock, and does not take account of your objectives, or your financial situation. We aim to bring you long-term focused analysis driven by fundamental data. Note that our analysis may not factor in the latest price-sensitive company announcements or qualitative material. Simply Wall St has no position in any stocks mentioned.
Join A Paid User Research Session
You’ll receive a US$30 Amazon Gift card for 1 hour of your time while helping us build better investing tools for the individual investors like yourself. Sign up here
