
 Yahoo Finance
 Some Investors May Be Worried About Fresenius SE KGaA's (ETR:FRE) Returns On Capital
When it comes to investing, there are some useful financial metrics that can warn us when a business is potentially in trouble. More often than not, we'll see a declining return on capital employed (ROCE) and a declining amount of capital employed. This combination can tell you that not only is the company investing less, it's earning less on what it does invest. On that note, looking into Fresenius SE KGaA (ETR:FRE), we weren't too upbeat about how things were going.
Understanding Return On Capital Employed (ROCE)
If you haven't worked with ROCE before, it measures the 'return' (pre-tax profit) a company generates from capital employed in its business. Analysts use this formula to calculate it for Fresenius SE KGaA:
Return on Capital Employed = Earnings Before Interest and Tax (EBIT) ÷ (Total Assets - Current Liabilities)
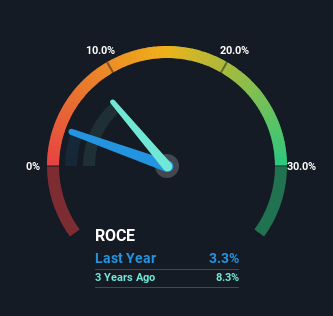
0.033 = €1.2b ÷ (€45b - €9.3b) (Based on the trailing twelve months to December 2023).
So, Fresenius SE KGaA has an ROCE of 3.3%. Ultimately, that's a low return and it under-performs the Healthcare industry average of 5.7%.
View our latest analysis for Fresenius SE KGaA
In the above chart we have measured Fresenius SE KGaA's prior ROCE against its prior performance, but the future is arguably more important. If you're interested, you can view the analysts predictions in our free analyst report for Fresenius SE KGaA .
So How Is Fresenius SE KGaA's ROCE Trending?
We are a bit worried about the trend of returns on capital at Fresenius SE KGaA. Unfortunately the returns on capital have diminished from the 10.0% that they were earning five years ago. And on the capital employed front, the business is utilizing roughly the same amount of capital as it was back then. Companies that exhibit these attributes tend to not be shrinking, but they can be mature and facing pressure on their margins from competition. If these trends continue, we wouldn't expect Fresenius SE KGaA to turn into a multi-bagger.
The Key Takeaway
In summary, it's unfortunate that Fresenius SE KGaA is generating lower returns from the same amount of capital. Long term shareholders who've owned the stock over the last five years have experienced a 40% depreciation in their investment, so it appears the market might not like these trends either. With underlying trends that aren't great in these areas, we'd consider looking elsewhere.
Fresenius SE KGaA does have some risks, we noticed 2 warning signs (and 1 which makes us a bit uncomfortable) we think you should know about.
While Fresenius SE KGaA isn't earning the highest return, check out this free list of companies that are earning high returns on equity with solid balance sheets.
Have feedback on this article? Concerned about the content? Get in touch with us directly. Alternatively, email editorial-team (at) simplywallst.com.
This article by Simply Wall St is general in nature. We provide commentary based on historical data and analyst forecasts only using an unbiased methodology and our articles are not intended to be financial advice. It does not constitute a recommendation to buy or sell any stock, and does not take account of your objectives, or your financial situation. We aim to bring you long-term focused analysis driven by fundamental data. Note that our analysis may not factor in the latest price-sensitive company announcements or qualitative material. Simply Wall St has no position in any stocks mentioned.
