
 Yahoo Finance
 Some Investors May Be Worried About Sportradar Group's (NASDAQ:SRAD) Returns On Capital
If you're not sure where to start when looking for the next multi-bagger, there are a few key trends you should keep an eye out for. In a perfect world, we'd like to see a company investing more capital into its business and ideally the returns earned from that capital are also increasing. Put simply, these types of businesses are compounding machines, meaning they are continually reinvesting their earnings at ever-higher rates of return. In light of that, when we looked at Sportradar Group (NASDAQ:SRAD) and its ROCE trend, we weren't exactly thrilled.
What Is Return On Capital Employed (ROCE)?
If you haven't worked with ROCE before, it measures the 'return' (pre-tax profit) a company generates from capital employed in its business. Analysts use this formula to calculate it for Sportradar Group:
Return on Capital Employed = Earnings Before Interest and Tax (EBIT) ÷ (Total Assets - Current Liabilities)
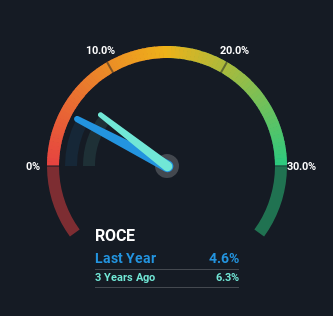
0.046 = €87m ÷ (€2.2b - €354m) (Based on the trailing twelve months to March 2024).
So, Sportradar Group has an ROCE of 4.6%. In absolute terms, that's a low return and it also under-performs the Hospitality industry average of 11%.
View our latest analysis for Sportradar Group
Above you can see how the current ROCE for Sportradar Group compares to its prior returns on capital, but there's only so much you can tell from the past. If you're interested, you can view the analysts predictions in our free analyst report for Sportradar Group .
So How Is Sportradar Group's ROCE Trending?
On the surface, the trend of ROCE at Sportradar Group doesn't inspire confidence. Over the last four years, returns on capital have decreased to 4.6% from 7.7% four years ago. However, given capital employed and revenue have both increased it appears that the business is currently pursuing growth, at the consequence of short term returns. If these investments prove successful, this can bode very well for long term stock performance.
The Bottom Line
Even though returns on capital have fallen in the short term, we find it promising that revenue and capital employed have both increased for Sportradar Group. These growth trends haven't led to growth returns though, since the stock has fallen 24% over the last year. So we think it'd be worthwhile to look further into this stock given the trends look encouraging.
If you want to continue researching Sportradar Group, you might be interested to know about the 1 warning sign that our analysis has discovered.
While Sportradar Group isn't earning the highest return, check out this free list of companies that are earning high returns on equity with solid balance sheets.
Have feedback on this article? Concerned about the content? Get in touch with us directly. Alternatively, email editorial-team (at) simplywallst.com.
This article by Simply Wall St is general in nature. We provide commentary based on historical data and analyst forecasts only using an unbiased methodology and our articles are not intended to be financial advice. It does not constitute a recommendation to buy or sell any stock, and does not take account of your objectives, or your financial situation. We aim to bring you long-term focused analysis driven by fundamental data. Note that our analysis may not factor in the latest price-sensitive company announcements or qualitative material. Simply Wall St has no position in any stocks mentioned.
Have feedback on this article? Concerned about the content? Get in touch with us directly. Alternatively, email editorial-team@simplywallst.com
