
 Yahoo Finance
 Investors one-year losses continue as Schindler Holding (VTX:SCHN) dips a further 5.2% this week, earnings continue to decline
Passive investing in an index fund is a good way to ensure your own returns roughly match the overall market. When you buy individual stocks, you can make higher profits, but you also face the risk of under-performance. Unfortunately the Schindler Holding AG (VTX:SCHN) share price slid 32% over twelve months. That's disappointing when you consider the market declined 13%. Zooming out, the stock is down 29% in the last three years. The last week also saw the share price slip down another 5.2%.
Since Schindler Holding has shed CHF990m from its value in the past 7 days, let's see if the longer term decline has been driven by the business' economics.
See our latest analysis for Schindler Holding
In his essay The Superinvestors of Graham-and-Doddsville Warren Buffett described how share prices do not always rationally reflect the value of a business. One imperfect but simple way to consider how the market perception of a company has shifted is to compare the change in the earnings per share (EPS) with the share price movement.
Unhappily, Schindler Holding had to report a 30% decline in EPS over the last year. We note that the 32% share price drop is very close to the EPS drop. Given the lower EPS we might have expected investors to lose confidence in the stock, but that doesn't seemed to have happened. Rather, the share price has approximately tracked EPS growth.
The graphic below depicts how EPS has changed over time (unveil the exact values by clicking on the image).
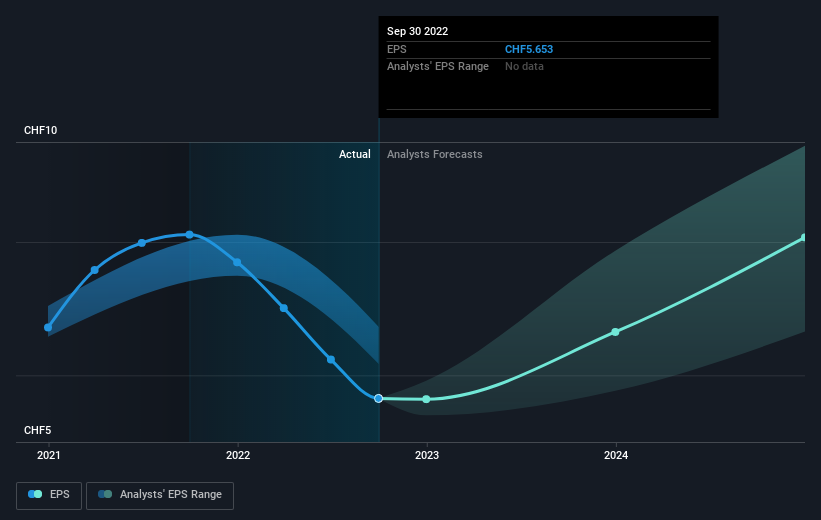
It's probably worth noting that the CEO is paid less than the median at similar sized companies. It's always worth keeping an eye on CEO pay, but a more important question is whether the company will grow earnings throughout the years. Before buying or selling a stock, we always recommend a close examination of historic growth trends, available here..
A Different Perspective
While the broader market lost about 13% in the twelve months, Schindler Holding shareholders did even worse, losing 31% (even including dividends). However, it could simply be that the share price has been impacted by broader market jitters. It might be worth keeping an eye on the fundamentals, in case there's a good opportunity. Regrettably, last year's performance caps off a bad run, with the shareholders facing a total loss of 3% per year over five years. Generally speaking long term share price weakness can be a bad sign, though contrarian investors might want to research the stock in hope of a turnaround. Is Schindler Holding cheap compared to other companies? These 3 valuation measures might help you decide.
But note: Schindler Holding may not be the best stock to buy. So take a peek at this free list of interesting companies with past earnings growth (and further growth forecast).
Please note, the market returns quoted in this article reflect the market weighted average returns of stocks that currently trade on CH exchanges.
Have feedback on this article? Concerned about the content? Get in touch with us directly. Alternatively, email editorial-team (at) simplywallst.com.
This article by Simply Wall St is general in nature. We provide commentary based on historical data and analyst forecasts only using an unbiased methodology and our articles are not intended to be financial advice. It does not constitute a recommendation to buy or sell any stock, and does not take account of your objectives, or your financial situation. We aim to bring you long-term focused analysis driven by fundamental data. Note that our analysis may not factor in the latest price-sensitive company announcements or qualitative material. Simply Wall St has no position in any stocks mentioned.
Join A Paid User Research Session
You’ll receive a US$30 Amazon Gift card for 1 hour of your time while helping us build better investing tools for the individual investors like yourself. Sign up here
