
 Yahoo Finance
 Investors in Oxford Metrics (LON:OMG) have unfortunately lost 31% over the last year
It's easy to match the overall market return by buying an index fund. But if you buy individual stocks, you can do both better or worse than that. For example, the Oxford Metrics plc (LON:OMG) share price is down 32% in the last year. That's well below the market decline of 11%. At least the damage isn't so bad if you look at the last three years, since the stock is down 6.8% in that time. Furthermore, it's down 20% in about a quarter. That's not much fun for holders.
So let's have a look and see if the longer term performance of the company has been in line with the underlying business' progress.
Check out our latest analysis for Oxford Metrics
While the efficient markets hypothesis continues to be taught by some, it has been proven that markets are over-reactive dynamic systems, and investors are not always rational. By comparing earnings per share (EPS) and share price changes over time, we can get a feel for how investor attitudes to a company have morphed over time.
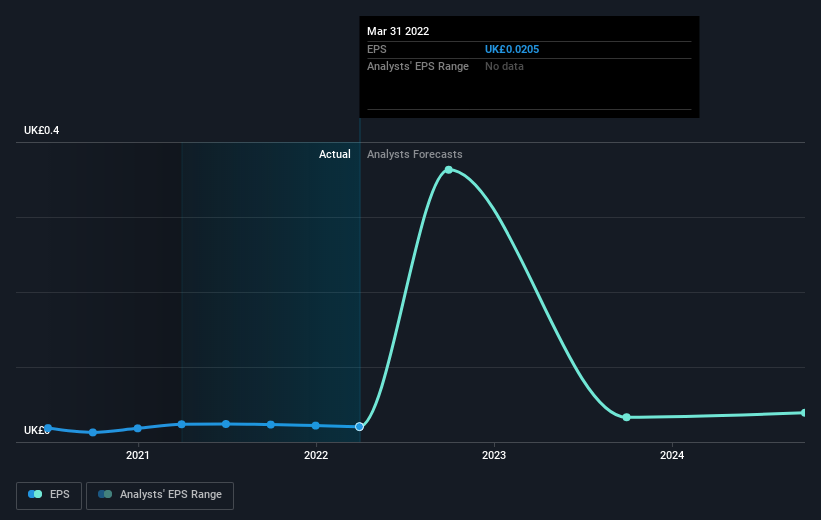
Unfortunately Oxford Metrics reported an EPS drop of 13% for the last year. This reduction in EPS is not as bad as the 32% share price fall. This suggests the EPS fall has made some shareholders are more nervous about the business.
You can see how EPS has changed over time in the image below (click on the chart to see the exact values).
It might be well worthwhile taking a look at our free report on Oxford Metrics' earnings, revenue and cash flow.
A Different Perspective
We regret to report that Oxford Metrics shareholders are down 31% for the year (even including dividends). Unfortunately, that's worse than the broader market decline of 11%. However, it could simply be that the share price has been impacted by broader market jitters. It might be worth keeping an eye on the fundamentals, in case there's a good opportunity. Longer term investors wouldn't be so upset, since they would have made 8%, each year, over five years. It could be that the recent sell-off is an opportunity, so it may be worth checking the fundamental data for signs of a long term growth trend. I find it very interesting to look at share price over the long term as a proxy for business performance. But to truly gain insight, we need to consider other information, too. Even so, be aware that Oxford Metrics is showing 5 warning signs in our investment analysis , and 1 of those makes us a bit uncomfortable...
If you are like me, then you will not want to miss this free list of growing companies that insiders are buying.
Please note, the market returns quoted in this article reflect the market weighted average returns of stocks that currently trade on GB exchanges.
Have feedback on this article? Concerned about the content? Get in touch with us directly. Alternatively, email editorial-team (at) simplywallst.com.
This article by Simply Wall St is general in nature. We provide commentary based on historical data and analyst forecasts only using an unbiased methodology and our articles are not intended to be financial advice. It does not constitute a recommendation to buy or sell any stock, and does not take account of your objectives, or your financial situation. We aim to bring you long-term focused analysis driven by fundamental data. Note that our analysis may not factor in the latest price-sensitive company announcements or qualitative material. Simply Wall St has no position in any stocks mentioned.
Join A Paid User Research Session
You’ll receive a US$30 Amazon Gift card for 1 hour of your time while helping us build better investing tools for the individual investors like yourself. Sign up here
