
 Yahoo Finance
 Investors in Regis Resources (ASX:RRL) have unfortunately lost 55% over the last five years
Statistically speaking, long term investing is a profitable endeavour. But unfortunately, some companies simply don't succeed. Zooming in on an example, the Regis Resources Limited (ASX:RRL) share price dropped 60% in the last half decade. That is extremely sub-optimal, to say the least. More recently, the share price has dropped a further 9.0% in a month.
Since shareholders are down over the longer term, lets look at the underlying fundamentals over the that time and see if they've been consistent with returns.
See our latest analysis for Regis Resources
Regis Resources wasn't profitable in the last twelve months, it is unlikely we'll see a strong correlation between its share price and its earnings per share (EPS). Arguably revenue is our next best option. When a company doesn't make profits, we'd generally hope to see good revenue growth. Some companies are willing to postpone profitability to grow revenue faster, but in that case one would hope for good top-line growth to make up for the lack of earnings.
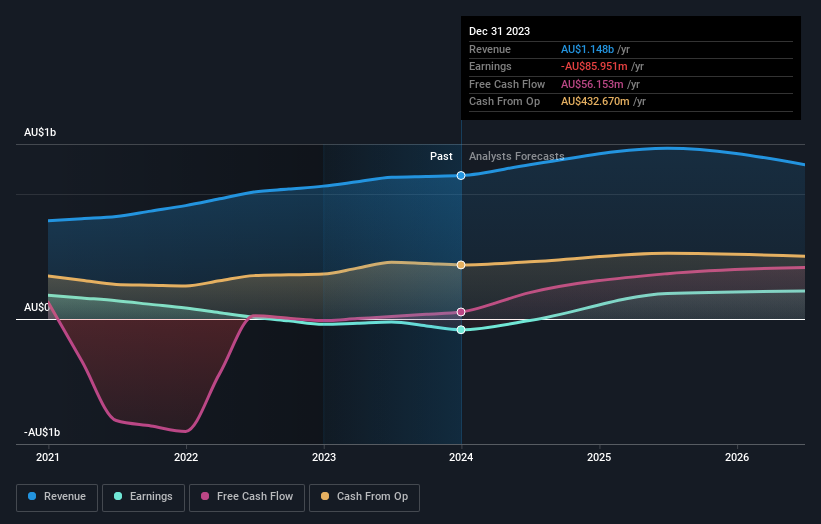
In the last half decade, Regis Resources saw its revenue increase by 13% per year. That's a pretty good rate for a long time period. The share price return isn't so respectable with an annual loss of 10% over the period. That suggests the market is disappointed with the current growth rate. That could lead to an opportunity if the company is going to become profitable sooner rather than later.
The graphic below depicts how earnings and revenue have changed over time (unveil the exact values by clicking on the image).
Regis Resources is well known by investors, and plenty of clever analysts have tried to predict the future profit levels. Given we have quite a good number of analyst forecasts, it might be well worth checking out this free chart depicting consensus estimates.
What About The Total Shareholder Return (TSR)?
We'd be remiss not to mention the difference between Regis Resources' total shareholder return (TSR) and its share price return. The TSR is a return calculation that accounts for the value of cash dividends (assuming that any dividend received was reinvested) and the calculated value of any discounted capital raisings and spin-offs. Regis Resources' TSR of was a loss of 55% for the 5 years. That wasn't as bad as its share price return, because it has paid dividends.
A Different Perspective
Investors in Regis Resources had a tough year, with a total loss of 5.9%, against a market gain of about 15%. Even the share prices of good stocks drop sometimes, but we want to see improvements in the fundamental metrics of a business, before getting too interested. However, the loss over the last year isn't as bad as the 9% per annum loss investors have suffered over the last half decade. We'd need to see some sustained improvements in the key metrics before we could muster much enthusiasm. If you would like to research Regis Resources in more detail then you might want to take a look at whether insiders have been buying or selling shares in the company.
Of course Regis Resources may not be the best stock to buy. So you may wish to see this free collection of growth stocks.
Please note, the market returns quoted in this article reflect the market weighted average returns of stocks that currently trade on Australian exchanges.
Have feedback on this article? Concerned about the content? Get in touch with us directly. Alternatively, email editorial-team (at) simplywallst.com.
This article by Simply Wall St is general in nature. We provide commentary based on historical data and analyst forecasts only using an unbiased methodology and our articles are not intended to be financial advice. It does not constitute a recommendation to buy or sell any stock, and does not take account of your objectives, or your financial situation. We aim to bring you long-term focused analysis driven by fundamental data. Note that our analysis may not factor in the latest price-sensitive company announcements or qualitative material. Simply Wall St has no position in any stocks mentioned.
