
 Yahoo Finance
 Investors in SSP Group (LON:SSPG) from three years ago are still down 55%, even after 8.3% gain this past week
Investing in stocks inevitably means buying into some companies that perform poorly. Long term SSP Group plc (LON:SSPG) shareholders know that all too well, since the share price is down considerably over three years. Sadly for them, the share price is down 65% in that time. More recently, the share price has dropped a further 17% in a month.
While the last three years has been tough for SSP Group shareholders, this past week has shown signs of promise. So let's look at the longer term fundamentals and see if they've been the driver of the negative returns.
See our latest analysis for SSP Group
To quote Buffett, 'Ships will sail around the world but the Flat Earth Society will flourish. There will continue to be wide discrepancies between price and value in the marketplace...' One flawed but reasonable way to assess how sentiment around a company has changed is to compare the earnings per share (EPS) with the share price.
Over the three years that the share price declined, SSP Group's earnings per share (EPS) dropped significantly, falling to a loss. Since the company has fallen to a loss making position, it's hard to compare the change in EPS with the share price change. However, we can say we'd expect to see a falling share price in this scenario.
The graphic below depicts how EPS has changed over time (unveil the exact values by clicking on the image).
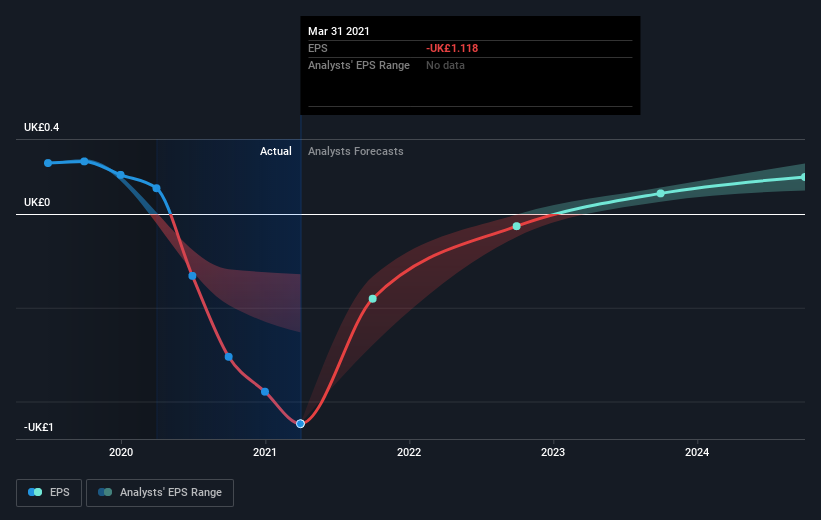
We like that insiders have been buying shares in the last twelve months. Even so, future earnings will be far more important to whether current shareholders make money. It might be well worthwhile taking a look at our free report on SSP Group's earnings, revenue and cash flow.
What about the Total Shareholder Return (TSR)?
We'd be remiss not to mention the difference between SSP Group's total shareholder return (TSR) and its share price return. The TSR attempts to capture the value of dividends (as if they were reinvested) as well as any spin-offs or discounted capital raisings offered to shareholders. SSP Group's TSR of was a loss of 55% for the 3 years. That wasn't as bad as its share price return, because it has paid dividends.
A Different Perspective
SSP Group shareholders are down 19% for the year, but the market itself is up 17%. Even the share prices of good stocks drop sometimes, but we want to see improvements in the fundamental metrics of a business, before getting too interested. Regrettably, last year's performance caps off a bad run, with the shareholders facing a total loss of 4% per year over five years. Generally speaking long term share price weakness can be a bad sign, though contrarian investors might want to research the stock in hope of a turnaround. While it is well worth considering the different impacts that market conditions can have on the share price, there are other factors that are even more important. Case in point: We've spotted 4 warning signs for SSP Group you should be aware of, and 2 of them are concerning.
SSP Group is not the only stock insiders are buying. So take a peek at this free list of growing companies with insider buying.
Please note, the market returns quoted in this article reflect the market weighted average returns of stocks that currently trade on GB exchanges.
Have feedback on this article? Concerned about the content? Get in touch with us directly. Alternatively, email editorial-team (at) simplywallst.com.
This article by Simply Wall St is general in nature. We provide commentary based on historical data and analyst forecasts only using an unbiased methodology and our articles are not intended to be financial advice. It does not constitute a recommendation to buy or sell any stock, and does not take account of your objectives, or your financial situation. We aim to bring you long-term focused analysis driven by fundamental data. Note that our analysis may not factor in the latest price-sensitive company announcements or qualitative material. Simply Wall St has no position in any stocks mentioned.
