
 Yahoo Finance
 Investors in Universal Insurance Holdings (NYSE:UVE) have unfortunately lost 17% over the last five years
The main aim of stock picking is to find the market-beating stocks. But every investor is virtually certain to have both over-performing and under-performing stocks. So we wouldn't blame long term Universal Insurance Holdings, Inc. (NYSE:UVE) shareholders for doubting their decision to hold, with the stock down 35% over a half decade.
It's worthwhile assessing if the company's economics have been moving in lockstep with these underwhelming shareholder returns, or if there is some disparity between the two. So let's do just that.
See our latest analysis for Universal Insurance Holdings
In his essay The Superinvestors of Graham-and-Doddsville Warren Buffett described how share prices do not always rationally reflect the value of a business. By comparing earnings per share (EPS) and share price changes over time, we can get a feel for how investor attitudes to a company have morphed over time.
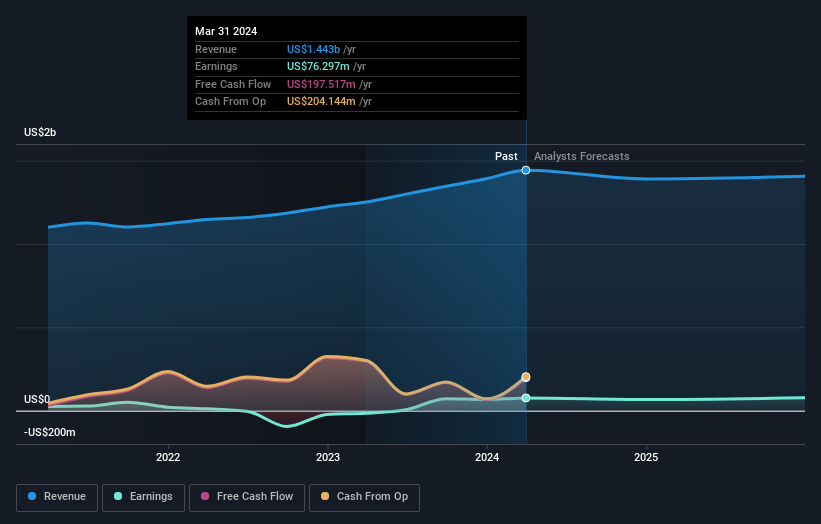
During five years of share price growth, Universal Insurance Holdings moved from a loss to profitability. Most would consider that to be a good thing, so it's counter-intuitive to see the share price declining. Other metrics may better explain the share price move.
We note that the dividend has remained healthy, so that wouldn't really explain the share price drop. It's not immediately clear to us why the stock price is down but further research might provide some answers.
The graphic below depicts how earnings and revenue have changed over time (unveil the exact values by clicking on the image).
It is of course excellent to see how Universal Insurance Holdings has grown profits over the years, but the future is more important for shareholders. Take a more thorough look at Universal Insurance Holdings' financial health with this free report on its balance sheet.
What About Dividends?
When looking at investment returns, it is important to consider the difference between total shareholder return (TSR) and share price return. The TSR incorporates the value of any spin-offs or discounted capital raisings, along with any dividends, based on the assumption that the dividends are reinvested. Arguably, the TSR gives a more comprehensive picture of the return generated by a stock. As it happens, Universal Insurance Holdings' TSR for the last 5 years was -17%, which exceeds the share price return mentioned earlier. This is largely a result of its dividend payments!
A Different Perspective
Universal Insurance Holdings provided a TSR of 20% over the last twelve months. But that return falls short of the market. But at least that's still a gain! Over five years the TSR has been a reduction of 3% per year, over five years. So this might be a sign the business has turned its fortunes around. It's always interesting to track share price performance over the longer term. But to understand Universal Insurance Holdings better, we need to consider many other factors. Take risks, for example - Universal Insurance Holdings has 1 warning sign we think you should be aware of.
But note: Universal Insurance Holdings may not be the best stock to buy. So take a peek at this free list of interesting companies with past earnings growth (and further growth forecast).
Please note, the market returns quoted in this article reflect the market weighted average returns of stocks that currently trade on American exchanges.
Have feedback on this article? Concerned about the content? Get in touch with us directly. Alternatively, email editorial-team (at) simplywallst.com.
This article by Simply Wall St is general in nature. We provide commentary based on historical data and analyst forecasts only using an unbiased methodology and our articles are not intended to be financial advice. It does not constitute a recommendation to buy or sell any stock, and does not take account of your objectives, or your financial situation. We aim to bring you long-term focused analysis driven by fundamental data. Note that our analysis may not factor in the latest price-sensitive company announcements or qualitative material. Simply Wall St has no position in any stocks mentioned.
