
 Yahoo Finance
 Investors Will Want Fletcher Building's (NZSE:FBU) Growth In ROCE To Persist
To find a multi-bagger stock, what are the underlying trends we should look for in a business? In a perfect world, we'd like to see a company investing more capital into its business and ideally the returns earned from that capital are also increasing. Basically this means that a company has profitable initiatives that it can continue to reinvest in, which is a trait of a compounding machine. So on that note, Fletcher Building (NZSE:FBU) looks quite promising in regards to its trends of return on capital.
What Is Return On Capital Employed (ROCE)?
For those that aren't sure what ROCE is, it measures the amount of pre-tax profits a company can generate from the capital employed in its business. To calculate this metric for Fletcher Building, this is the formula:
Return on Capital Employed = Earnings Before Interest and Tax (EBIT) ÷ (Total Assets - Current Liabilities)
0.11 = NZ$748m ÷ (NZ$9.1b - NZ$2.2b) (Based on the trailing twelve months to December 2023).
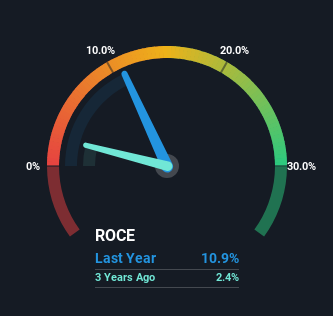
So, Fletcher Building has an ROCE of 11%. In absolute terms, that's a pretty normal return, and it's somewhat close to the Building industry average of 12%.
Check out our latest analysis for Fletcher Building
Above you can see how the current ROCE for Fletcher Building compares to its prior returns on capital, but there's only so much you can tell from the past. If you'd like, you can check out the forecasts from the analysts covering Fletcher Building here for free.
How Are Returns Trending?
We're delighted to see that Fletcher Building is reaping rewards from its investments and has now broken into profitability. The company now earns 11% on its capital, because five years ago it was incurring losses. Interestingly, the capital employed by the business has remained relatively flat, so these higher returns are either from prior investments paying off or increased efficiencies. So while we're happy that the business is more efficient, just keep in mind that could mean that going forward the business is lacking areas to invest internally for growth. Because in the end, a business can only get so efficient.
In Conclusion...
In summary, we're delighted to see that Fletcher Building has been able to increase efficiencies and earn higher rates of return on the same amount of capital. Since the total return from the stock has been almost flat over the last five years, there might be an opportunity here if the valuation looks good. That being the case, research into the company's current valuation metrics and future prospects seems fitting.
On a final note, we found 3 warning signs for Fletcher Building (1 is potentially serious) you should be aware of.
While Fletcher Building isn't earning the highest return, check out this free list of companies that are earning high returns on equity with solid balance sheets.
Have feedback on this article? Concerned about the content? Get in touch with us directly. Alternatively, email editorial-team (at) simplywallst.com.
This article by Simply Wall St is general in nature. We provide commentary based on historical data and analyst forecasts only using an unbiased methodology and our articles are not intended to be financial advice. It does not constitute a recommendation to buy or sell any stock, and does not take account of your objectives, or your financial situation. We aim to bring you long-term focused analysis driven by fundamental data. Note that our analysis may not factor in the latest price-sensitive company announcements or qualitative material. Simply Wall St has no position in any stocks mentioned.
