
 Yahoo Finance
 Investors Will Want LKQ's (NASDAQ:LKQ) Growth In ROCE To Persist
If you're looking for a multi-bagger, there's a few things to keep an eye out for. Ideally, a business will show two trends; firstly a growing return on capital employed (ROCE) and secondly, an increasing amount of capital employed. Put simply, these types of businesses are compounding machines, meaning they are continually reinvesting their earnings at ever-higher rates of return. Speaking of which, we noticed some great changes in LKQ's (NASDAQ:LKQ) returns on capital, so let's have a look.
What Is Return On Capital Employed (ROCE)?
For those that aren't sure what ROCE is, it measures the amount of pre-tax profits a company can generate from the capital employed in its business. To calculate this metric for LKQ, this is the formula:
Return on Capital Employed = Earnings Before Interest and Tax (EBIT) ÷ (Total Assets - Current Liabilities)
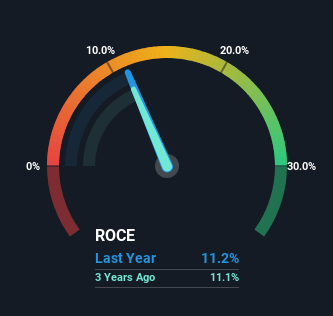
0.11 = US$1.4b ÷ (US$15b - US$3.1b) (Based on the trailing twelve months to March 2024).
Therefore, LKQ has an ROCE of 11%. In absolute terms, that's a pretty standard return but compared to the Retail Distributors industry average it falls behind.
See our latest analysis for LKQ
In the above chart we have measured LKQ's prior ROCE against its prior performance, but the future is arguably more important. If you're interested, you can view the analysts predictions in our free analyst report for LKQ .
The Trend Of ROCE
LKQ's ROCE growth is quite impressive. The figures show that over the last five years, ROCE has grown 25% whilst employing roughly the same amount of capital. Basically the business is generating higher returns from the same amount of capital and that is proof that there are improvements in the company's efficiencies. It's worth looking deeper into this though because while it's great that the business is more efficient, it might also mean that going forward the areas to invest internally for the organic growth are lacking.
What We Can Learn From LKQ's ROCE
As discussed above, LKQ appears to be getting more proficient at generating returns since capital employed has remained flat but earnings (before interest and tax) are up. And investors seem to expect more of this going forward, since the stock has rewarded shareholders with a 67% return over the last five years. With that being said, we still think the promising fundamentals mean the company deserves some further due diligence.
LKQ does have some risks though, and we've spotted 4 warning signs for LKQ that you might be interested in.
For those who like to invest in solid companies, check out this free list of companies with solid balance sheets and high returns on equity.
Have feedback on this article? Concerned about the content? Get in touch with us directly. Alternatively, email editorial-team (at) simplywallst.com.
This article by Simply Wall St is general in nature. We provide commentary based on historical data and analyst forecasts only using an unbiased methodology and our articles are not intended to be financial advice. It does not constitute a recommendation to buy or sell any stock, and does not take account of your objectives, or your financial situation. We aim to bring you long-term focused analysis driven by fundamental data. Note that our analysis may not factor in the latest price-sensitive company announcements or qualitative material. Simply Wall St has no position in any stocks mentioned.
