
 Yahoo Finance
 Investors Will Want Select Sands' (CVE:SNS) Growth In ROCE To Persist
What are the early trends we should look for to identify a stock that could multiply in value over the long term? Ideally, a business will show two trends; firstly a growing return on capital employed (ROCE) and secondly, an increasing amount of capital employed. Basically this means that a company has profitable initiatives that it can continue to reinvest in, which is a trait of a compounding machine. With that in mind, we've noticed some promising trends at Select Sands (CVE:SNS) so let's look a bit deeper.
What Is Return On Capital Employed (ROCE)?
For those who don't know, ROCE is a measure of a company's yearly pre-tax profit (its return), relative to the capital employed in the business. To calculate this metric for Select Sands, this is the formula:
Return on Capital Employed = Earnings Before Interest and Tax (EBIT) ÷ (Total Assets - Current Liabilities)
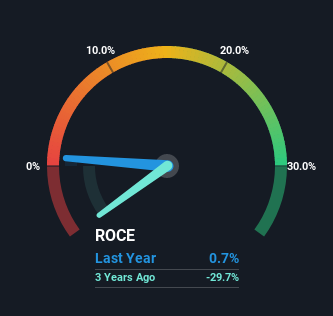
0.0074 = US$107k ÷ (US$20m - US$5.7m) (Based on the trailing twelve months to September 2022).
Therefore, Select Sands has an ROCE of 0.7%. In absolute terms, that's a low return and it also under-performs the Metals and Mining industry average of 1.6%.
See our latest analysis for Select Sands
While the past is not representative of the future, it can be helpful to know how a company has performed historically, which is why we have this chart above. If you'd like to look at how Select Sands has performed in the past in other metrics, you can view this free graph of past earnings, revenue and cash flow.
How Are Returns Trending?
We're delighted to see that Select Sands is reaping rewards from its investments and has now broken into profitability. While the business is profitable now, it used to be incurring losses on invested capital five years ago. Additionally, the business is utilizing 28% less capital than it was five years ago, and taken at face value, that can mean the company needs less funds at work to get a return. This could potentially mean that the company is selling some of its assets.
For the record though, there was a noticeable increase in the company's current liabilities over the period, so we would attribute some of the ROCE growth to that. Essentially the business now has suppliers or short-term creditors funding about 28% of its operations, which isn't ideal. It's worth keeping an eye on this because as the percentage of current liabilities to total assets increases, some aspects of risk also increase.
The Key Takeaway
In summary, it's great to see that Select Sands has been able to turn things around and earn higher returns on lower amounts of capital. However the stock is down a substantial 86% in the last five years so there could be other areas of the business hurting its prospects. In any case, we believe the economic trends of this company are positive and looking into the stock further could prove rewarding.
One final note, you should learn about the 3 warning signs we've spotted with Select Sands (including 2 which can't be ignored) .
While Select Sands isn't earning the highest return, check out this free list of companies that are earning high returns on equity with solid balance sheets.
Have feedback on this article? Concerned about the content? Get in touch with us directly. Alternatively, email editorial-team (at) simplywallst.com.
This article by Simply Wall St is general in nature. We provide commentary based on historical data and analyst forecasts only using an unbiased methodology and our articles are not intended to be financial advice. It does not constitute a recommendation to buy or sell any stock, and does not take account of your objectives, or your financial situation. We aim to bring you long-term focused analysis driven by fundamental data. Note that our analysis may not factor in the latest price-sensitive company announcements or qualitative material. Simply Wall St has no position in any stocks mentioned.
Join A Paid User Research Session
You’ll receive a US$30 Amazon Gift card for 1 hour of your time while helping us build better investing tools for the individual investors like yourself. Sign up here
