
 Yahoo Finance
 J Sainsbury plc (LON:SBRY) Might Not Be A Great Investment

Today we are going to look at J Sainsbury plc (LON:SBRY) to see whether it might be an attractive investment prospect. Specifically, we're going to calculate its Return On Capital Employed (ROCE), in the hopes of getting some insight into the business.
Firstly, we'll go over how we calculate ROCE. Next, we'll compare it to others in its industry. Finally, we'll look at how its current liabilities affect its ROCE.
Understanding Return On Capital Employed (ROCE)
ROCE is a metric for evaluating how much pre-tax income (in percentage terms) a company earns on the capital invested in its business. All else being equal, a better business will have a higher ROCE. In brief, it is a useful tool, but it is not without drawbacks. Renowned investment researcher Michael Mauboussin has suggested that a high ROCE can indicate that 'one dollar invested in the company generates value of more than one dollar'.
How Do You Calculate Return On Capital Employed?
Analysts use this formula to calculate return on capital employed:
Return on Capital Employed = Earnings Before Interest and Tax (EBIT) ÷ (Total Assets - Current Liabilities)
Or for J Sainsbury:
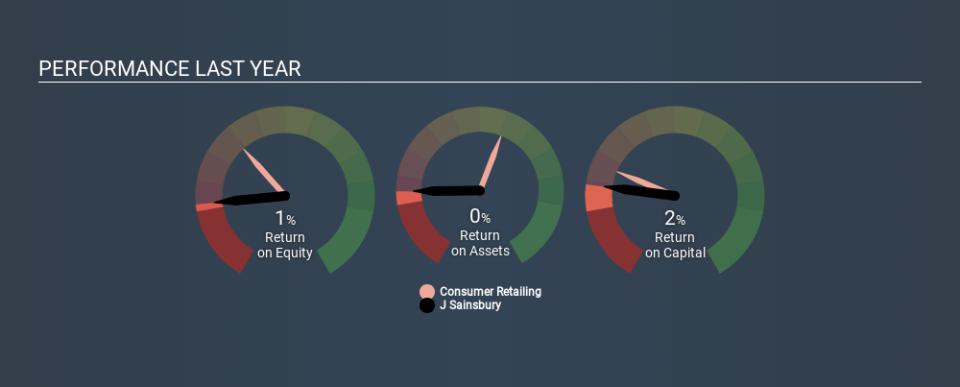
0.021 = UK£341m ÷ (UK£29b - UK£13b) (Based on the trailing twelve months to September 2019.)
Therefore, J Sainsbury has an ROCE of 2.1%.
Check out our latest analysis for J Sainsbury
Is J Sainsbury's ROCE Good?
One way to assess ROCE is to compare similar companies. Using our data, J Sainsbury's ROCE appears to be significantly below the 6.7% average in the Consumer Retailing industry. This could be seen as a negative, as it suggests some competitors may be employing their capital more efficiently. Putting aside J Sainsbury's performance relative to its industry, its ROCE in absolute terms is poor - considering the risk of owning stocks compared to government bonds. It is likely that there are more attractive prospects out there.
We can see that, J Sainsbury currently has an ROCE of 2.1%, less than the 3.9% it reported 3 years ago. This makes us wonder if the business is facing new challenges. You can see in the image below how J Sainsbury's ROCE compares to its industry. Click to see more on past growth.
It is important to remember that ROCE shows past performance, and is not necessarily predictive. ROCE can be misleading for companies in cyclical industries, with returns looking impressive during the boom times, but very weak during the busts. This is because ROCE only looks at one year, instead of considering returns across a whole cycle. Since the future is so important for investors, you should check out our free report on analyst forecasts for J Sainsbury.
How J Sainsbury's Current Liabilities Impact Its ROCE
Current liabilities include invoices, such as supplier payments, short-term debt, or a tax bill, that need to be paid within 12 months. The ROCE equation subtracts current liabilities from capital employed, so a company with a lot of current liabilities appears to have less capital employed, and a higher ROCE than otherwise. To counteract this, we check if a company has high current liabilities, relative to its total assets.
J Sainsbury has total assets of UK£29b and current liabilities of UK£13b. As a result, its current liabilities are equal to approximately 44% of its total assets. J Sainsbury has a medium level of current liabilities (boosting the ROCE somewhat), and a low ROCE.
Our Take On J Sainsbury's ROCE
So researching other companies may be a better use of your time. You might be able to find a better investment than J Sainsbury. If you want a selection of possible winners, check out this free list of interesting companies that trade on a P/E below 20 (but have proven they can grow earnings).
I will like J Sainsbury better if I see some big insider buys. While we wait, check out this free list of growing companies with considerable, recent, insider buying.
If you spot an error that warrants correction, please contact the editor at editorial-team@simplywallst.com. This article by Simply Wall St is general in nature. It does not constitute a recommendation to buy or sell any stock, and does not take account of your objectives, or your financial situation. Simply Wall St has no position in the stocks mentioned.
We aim to bring you long-term focused research analysis driven by fundamental data. Note that our analysis may not factor in the latest price-sensitive company announcements or qualitative material. Thank you for reading.
