
 Yahoo Finance
 New Jersey Resources (NYSE:NJR) Is Doing The Right Things To Multiply Its Share Price
What are the early trends we should look for to identify a stock that could multiply in value over the long term? In a perfect world, we'd like to see a company investing more capital into its business and ideally the returns earned from that capital are also increasing. If you see this, it typically means it's a company with a great business model and plenty of profitable reinvestment opportunities. With that in mind, we've noticed some promising trends at New Jersey Resources (NYSE:NJR) so let's look a bit deeper.
Understanding Return On Capital Employed (ROCE)
For those who don't know, ROCE is a measure of a company's yearly pre-tax profit (its return), relative to the capital employed in the business. The formula for this calculation on New Jersey Resources is:
Return on Capital Employed = Earnings Before Interest and Tax (EBIT) ÷ (Total Assets - Current Liabilities)
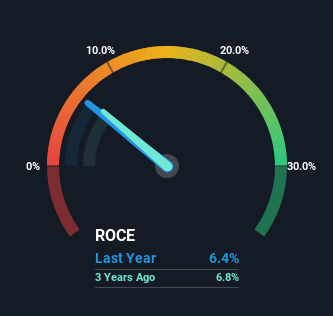
0.064 = US$375m ÷ (US$6.6b - US$789m) (Based on the trailing twelve months to March 2024).
Thus, New Jersey Resources has an ROCE of 6.4%. On its own that's a low return on capital but it's in line with the industry's average returns of 6.1%.
Check out our latest analysis for New Jersey Resources
In the above chart we have measured New Jersey Resources' prior ROCE against its prior performance, but the future is arguably more important. If you'd like to see what analysts are forecasting going forward, you should check out our free analyst report for New Jersey Resources .
So How Is New Jersey Resources' ROCE Trending?
We're glad to see that ROCE is heading in the right direction, even if it is still low at the moment. The data shows that returns on capital have increased substantially over the last five years to 6.4%. The amount of capital employed has increased too, by 67%. The increasing returns on a growing amount of capital is common amongst multi-baggers and that's why we're impressed.
In Conclusion...
To sum it up, New Jersey Resources has proven it can reinvest in the business and generate higher returns on that capital employed, which is terrific. And given the stock has remained rather flat over the last five years, there might be an opportunity here if other metrics are strong. So researching this company further and determining whether or not these trends will continue seems justified.
New Jersey Resources does have some risks, we noticed 2 warning signs (and 1 which can't be ignored) we think you should know about.
While New Jersey Resources isn't earning the highest return, check out this free list of companies that are earning high returns on equity with solid balance sheets.
Have feedback on this article? Concerned about the content? Get in touch with us directly. Alternatively, email editorial-team (at) simplywallst.com.
This article by Simply Wall St is general in nature. We provide commentary based on historical data and analyst forecasts only using an unbiased methodology and our articles are not intended to be financial advice. It does not constitute a recommendation to buy or sell any stock, and does not take account of your objectives, or your financial situation. We aim to bring you long-term focused analysis driven by fundamental data. Note that our analysis may not factor in the latest price-sensitive company announcements or qualitative material. Simply Wall St has no position in any stocks mentioned.
Have feedback on this article? Concerned about the content? Get in touch with us directly. Alternatively, email editorial-team@simplywallst.com
