
 Yahoo Finance
 John Bean Technologies (JBT) Q3 Earnings Beat Estimates
John Bean Technologies Corporation JBT reported adjusted earnings of $1.28 per share in third-quarter 2019 surpassing the Zacks Consensus Estimate of $1.08 and improved 14% from prior-year quarter figure of $1.12. Further, the figure was higher than management’s guidance of $1.05-$1.10. The improved performance can primarily be attributed to savings stemming from the restructuring program and implementation of the JBT operating system and higher percentage of revenues from aftermarket business.
On a reported basis, the company’s earnings per share of $1.04 reflects an improvement of 27% from the year-ago figure of 82 cents.
John Bean Technologies Corporation Price, Consensus and EPS Surprise
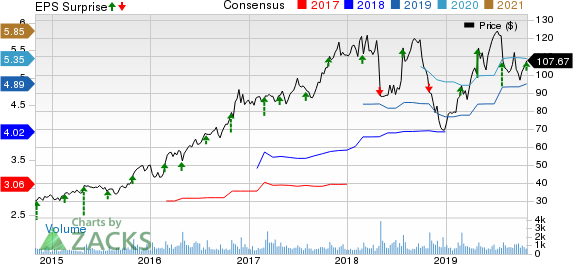
John Bean Technologies Corporation price-consensus-eps-surprise-chart | John Bean Technologies Corporation Quote
The company’s revenues of $489 million in the reported quarter fell short of the Zacks Consensus Estimate of $505 million. However, the top line improved 1.6% year over year. Acquisition growth of 10% helped offset a drop of 3% in organic sales, an unfavorable impact of foreign exchange of 2% and a decline of 4% thanks to the absence of the ASC 606 transition benefit recorded in third-quarter 2018.
Orders in the JBT FoodTech segment remained flat year over year at $283 million in the reported quarter. Orders in the JBT AeroTech segment were at $180 million, reflecting a year-over-year growth of 9%. Backlog in the FoodTech segment was down 8% in the reported quarter while the AeroTech segment saw a rise of 8%. At FoodTech, commercial activity has not converted to orders as quickly as last year owing to economic and trade uncertainty. However, market conditions for AeroTech remain solid.
Cost and Margins
Cost of sales dropped 1.4% year over year to $342 million in the reported quarter. Gross profit improved 9% year over year to $148 million. Gross margin expanded 220 basis points to 30.2%.
Selling, general and administrative expenses improved 12% year over year to $98 million. Adjusted operating profit climbed 4% year over year to $50 million. Adjusted operating margin expanded 20 bps year over year to 10.2% in the reported quarter. In the reported quarter, adjusted EBITDA came in at $75.8 million, up 15.4% year over year. The improvement in margins were driven by continued operational improvements as a result of the company’s restructuring program, implementation of the JBT operating system and a higher share of revenue from aftermarket business.
Segment Performance
JBT FoodTech: Net sales inched up 0.5% year over year to $334 million. Adjusted operating profit increased 15% from the prior-year quarter to $50 million.
JBT AeroTech: Net sales improved 4% year over year to $155 million. The segment reported adjusted operating profit of $22 million, up 25% year over year.
Financial Performance
John Bean Technologies reported cash and cash equivalents of $49 million as of Sep 30, 2019, up from $43 million as of Dec 31, 2018. The company generated $35 million of cash from operating activities during the nine-month period ended Sep 30, 2019 compared with $27 million reported in the prior-year comparable period. At the end of the third quarter of 2019, long-term debt was approximately $769 million, up from $387 million as of Dec 31, 2018.
Guidance
The company has narrowed earnings guidance for 2019 as it expects better-than-expected margin gains will be offset by softer FoodTech revenue. EPS is now expected between $4.80 and $4.90 for the year, down from the prior guidance of $4.70-$4.90. Compared with EPS of $4.28 in 2018, the mid-point of the guidance range reflects year-over-year growth of 13%.
The company anticipates organic growth of 2-3%, lower than prior guidance of 4-5%. While acquisitions are expected to contribute growth of around 7% to revenues, foreign exchange translation is anticipated to be a 2-3% headwind. Reported revenues are expected to be flat to up 1% year over year.
Price Performance

John Bean Technologies’ shares have gained 3.6% in the past year compared with the industry’s growth of 19.3%.
Zacks Rank & Stocks to Consider
John Bean Technologies currently carries a Zacks Rank #3 (Hold).
Some better-ranked stocks in the Industrial Products sector are Dover Corporation (DOV), Cintas Corporation CTAS and Brady Corporation BRC, each sporting a Zacks Rank #2 (Buy), at present. You can see the complete list of today’s Zacks #1 Rank (Strong Buy) stocks here.
Dover Corporation has an estimated earnings growth rate of 17.71% for 2019. The company’s shares have gained 27% in the past year.
Cintas has an expected earnings growth rate of 12.74% for the current year. The stock has appreciated 51% in a year’s time.
Brady Corporation has a projected earnings growth rate of 4.34% for the ongoing year. The company’s shares have rallied 45% over the past year.
Today's Best Stocks from Zacks
Would you like to see the updated picks from our best market-beating strategies? From 2017 through 2018, while the S&P 500 gained +15.8%, five of our screens returned +38.0%, +61.3%, +61.6%, +68.1%, and +98.3%.
This outperformance has not just been a recent phenomenon. From 2000 – 2018, while the S&P averaged +4.8% per year, our top strategies averaged up to +56.2% per year.
See their latest picks free >>
Want the latest recommendations from Zacks Investment Research? Today, you can download 7 Best Stocks for the Next 30 Days. Click to get this free report
Cintas Corporation (CTAS) : Free Stock Analysis Report
John Bean Technologies Corporation (JBT) : Free Stock Analysis Report
Brady Corporation (BRC) : Free Stock Analysis Report
To read this article on Zacks.com click here.
Zacks Investment Research
