
 Yahoo Finance
 Journey Energy's (TSE:JOY) investors will be pleased with their strong 126% return over the last three years
Journey Energy Inc. (TSE:JOY) shareholders might be concerned after seeing the share price drop 20% in the last month. But that doesn't change the fact that the returns over the last three years have been very strong. The share price marched upwards over that time, and is now 126% higher than it was. So the recent fall in the share price should be viewed in that context. Only time will tell if there is still too much optimism currently reflected in the share price.
Let's take a look at the underlying fundamentals over the longer term, and see if they've been consistent with shareholders returns.
View our latest analysis for Journey Energy
While markets are a powerful pricing mechanism, share prices reflect investor sentiment, not just underlying business performance. By comparing earnings per share (EPS) and share price changes over time, we can get a feel for how investor attitudes to a company have morphed over time.
Over the last three years, Journey Energy failed to grow earnings per share, which fell 5.3% (annualized).
This means it's unlikely the market is judging the company based on earnings growth. Since the change in EPS doesn't seem to correlate with the change in share price, it's worth taking a look at other metrics.
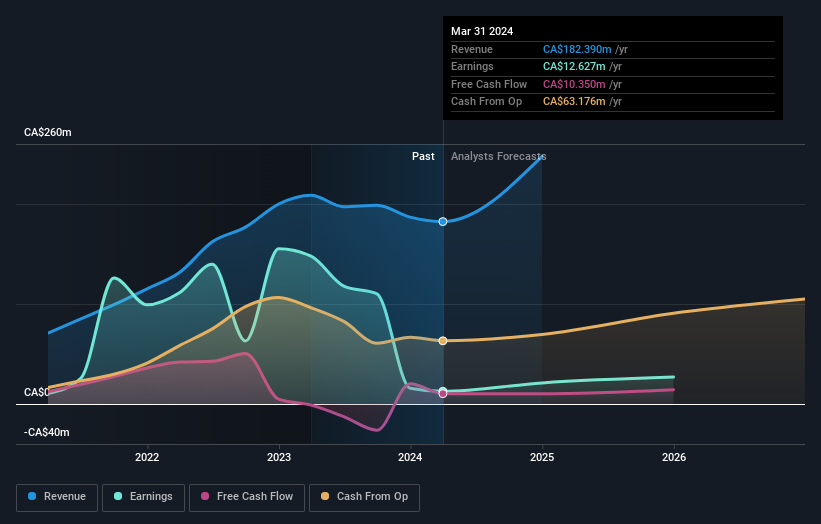
It could be that the revenue growth of 29% per year is viewed as evidence that Journey Energy is growing. If the company is being managed for the long term good, today's shareholders might be right to hold on.
The company's revenue and earnings (over time) are depicted in the image below (click to see the exact numbers).
It's probably worth noting we've seen significant insider buying in the last quarter, which we consider a positive. That said, we think earnings and revenue growth trends are even more important factors to consider. So we recommend checking out this free report showing consensus forecasts
A Different Perspective
Journey Energy shareholders are down 43% for the year, but the market itself is up 14%. Even the share prices of good stocks drop sometimes, but we want to see improvements in the fundamental metrics of a business, before getting too interested. Longer term investors wouldn't be so upset, since they would have made 4%, each year, over five years. It could be that the recent sell-off is an opportunity, so it may be worth checking the fundamental data for signs of a long term growth trend. It's always interesting to track share price performance over the longer term. But to understand Journey Energy better, we need to consider many other factors. For example, we've discovered 2 warning signs for Journey Energy that you should be aware of before investing here.
Journey Energy is not the only stock insiders are buying. So take a peek at this free list of small cap companies at attractive valuations which insiders have been buying.
Please note, the market returns quoted in this article reflect the market weighted average returns of stocks that currently trade on Canadian exchanges.
Have feedback on this article? Concerned about the content? Get in touch with us directly. Alternatively, email editorial-team (at) simplywallst.com.
This article by Simply Wall St is general in nature. We provide commentary based on historical data and analyst forecasts only using an unbiased methodology and our articles are not intended to be financial advice. It does not constitute a recommendation to buy or sell any stock, and does not take account of your objectives, or your financial situation. We aim to bring you long-term focused analysis driven by fundamental data. Note that our analysis may not factor in the latest price-sensitive company announcements or qualitative material. Simply Wall St has no position in any stocks mentioned.
Have feedback on this article? Concerned about the content? Get in touch with us directly. Alternatively, email editorial-team@simplywallst.com
