
 Yahoo Finance
 June 2024 Insight Into High Insider Ownership Growth Stocks On The Japanese Exchange
Japan's stock market has shown resilience with mixed weekly returns, reflecting a complex interplay of domestic economic indicators and global market trends. As investors navigate this landscape, stocks with high insider ownership in growth-oriented companies may offer a unique appeal, aligning shareholder interests with management and potentially signaling confidence in the company's prospects.
Top 10 Growth Companies With High Insider Ownership In Japan
Name | Insider Ownership | Earnings Growth |
SHIFT (TSE:3697) | 35.4% | 26.8% |
Kanamic NetworkLTD (TSE:3939) | 25% | 28.9% |
Hottolink (TSE:3680) | 27% | 57.3% |
Medley (TSE:4480) | 34% | 28.7% |
Micronics Japan (TSE:6871) | 15.3% | 39.7% |
Kasumigaseki CapitalLtd (TSE:3498) | 34.8% | 44.6% |
ExaWizards (TSE:4259) | 24.8% | 80.2% |
Money Forward (TSE:3994) | 21.4% | 63.6% |
Soiken Holdings (TSE:2385) | 19.8% | 118.4% |
Soracom (TSE:147A) | 17.2% | 54.1% |
Here we highlight a subset of our preferred stocks from the screener.
Mercari
Simply Wall St Growth Rating: ★★★★☆☆
Overview: Mercari, Inc. operates a marketplace application in Japan and the United States, focusing on the buying and selling of goods, with a market capitalization of approximately ¥359 billion.
Operations: The company's revenue is generated primarily from its marketplace applications active in Japan and the U.S.
Insider Ownership: 36%
Return On Equity Forecast: 23% (2027 estimate)
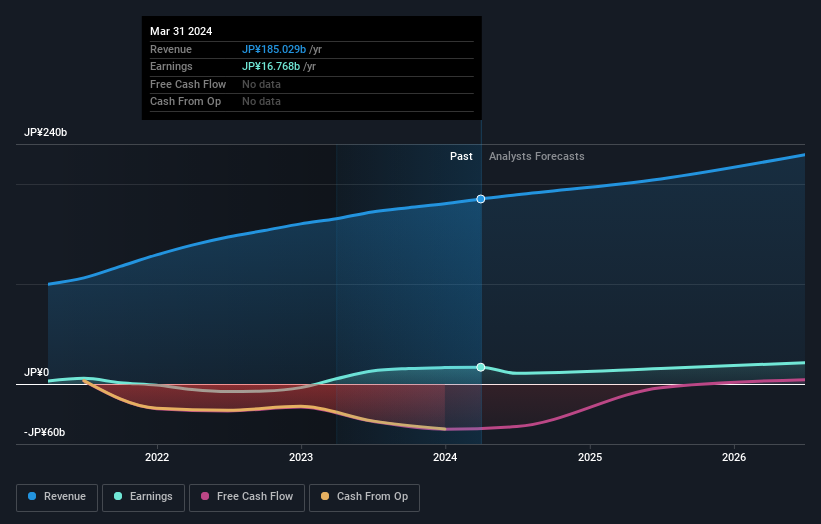
Mercari, a Japanese growth company with high insider ownership, has shown robust performance with earnings growth of 222.8% over the past year and is forecasted to grow at 19.1% per year, outpacing the Japanese market's 8.7%. Despite a highly volatile share price recently, its revenue is also set to increase by 9.9% annually, faster than the market average of 4%. Additionally, Mercari has innovated by eliminating selling fees to enhance competitiveness and attract more users in its U.S operations.
Get an in-depth perspective on Mercari's performance by reading our analyst estimates report here.
Upon reviewing our latest valuation report, Mercari's share price might be too optimistic.
Micronics Japan
Simply Wall St Growth Rating: ★★★★★★
Overview: Micronics Japan Co., Ltd. specializes in developing, manufacturing, and selling testing and measurement equipment for semiconductors and LCD systems globally, with a market capitalization of approximately ¥236.50 billion.
Operations: The firm specializes in the development and sale of semiconductor and LCD testing equipment, generating revenue globally.
Insider Ownership: 15.3%
Return On Equity Forecast: 26% (2027 estimate)
Micronics Japan, characterized by high insider ownership, is trading at a significant discount of 41.1% below its estimated fair value. Despite a volatile share price recently, the company's financial outlook appears strong with expected annual revenue growth of 23.3% and earnings growth forecasted at 39.7%. However, its profit margins have declined from last year's 16.7% to 10.6%. Looking ahead, Micronics Japan’s Return on Equity is anticipated to reach an impressive 26.5% in three years.
Dive into the specifics of Micronics Japan here with our thorough growth forecast report.
Our expertly prepared valuation report Micronics Japan implies its share price may be too high.

Relo Group
Simply Wall St Growth Rating: ★★★★★☆
Overview: Relo Group, Inc. operates in Japan, offering property management services with a market capitalization of approximately ¥256.93 billion.
Operations: The company generates revenue primarily through three segments: ¥92.67 billion from relocation services, ¥25.32 billion from welfare programs, and ¥14.16 billion from tourism activities.
Insider Ownership: 27.5%
Return On Equity Forecast: 25% (2027 estimate)
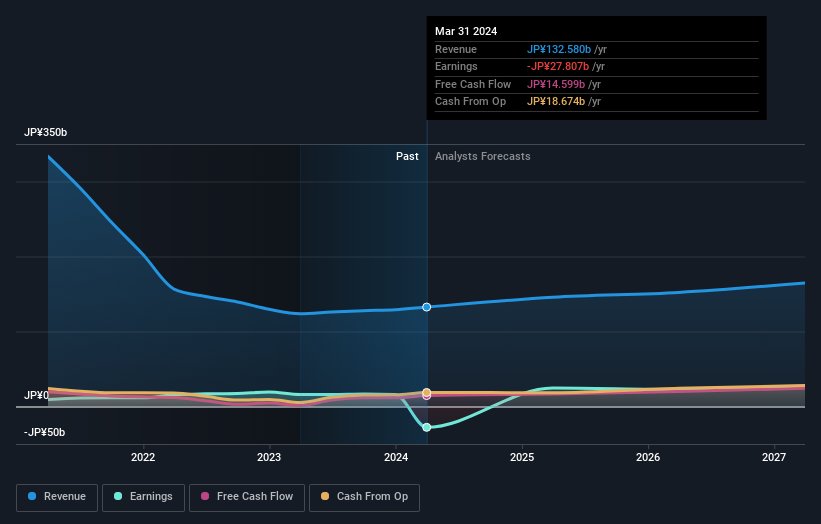
Relo Group, amidst corporate governance enhancements and strategic personnel shifts, is poised for notable growth with its revenue expected to increase by 7% annually. Although trading at a 34.5% discount to its fair value and grappling with high debt levels, the company forecasts a sharp 45.65% annual earnings growth over the next three years. Recent dividend increases reflect positive financial maneuvers despite concerns about their coverage by earnings. This strategic direction could bolster investor confidence in Relo's governance and financial prospects.
Click here to discover the nuances of Relo Group with our detailed analytical future growth report.
Our valuation report unveils the possibility Relo Group's shares may be trading at a discount.
Summing It All Up
Take a closer look at our Fast Growing Japanese Companies With High Insider Ownership list of 104 companies by clicking here.
Invested in any of these stocks? Simplify your portfolio management with Simply Wall St and stay ahead with our alerts for any critical updates on your stocks.
Take control of your financial future using Simply Wall St, offering free, in-depth knowledge of international markets to every investor.
Searching for a Fresh Perspective?
Explore high-performing small cap companies that haven't yet garnered significant analyst attention.
Diversify your portfolio with solid dividend payers offering reliable income streams to weather potential market turbulence.
Find companies with promising cash flow potential yet trading below their fair value.
This article by Simply Wall St is general in nature. We provide commentary based on historical data and analyst forecasts only using an unbiased methodology and our articles are not intended to be financial advice. It does not constitute a recommendation to buy or sell any stock, and does not take account of your objectives, or your financial situation. We aim to bring you long-term focused analysis driven by fundamental data. Note that our analysis may not factor in the latest price-sensitive company announcements or qualitative material. Simply Wall St has no position in any stocks mentioned.The analysis only considers stock directly held by insiders. It does not include indirectly owned stock through other vehicles such as corporate and/or trust entities. All forecast revenue and earnings growth rates quoted are in terms of annualised (per annum) growth rates over 1-3 years.
Companies discussed in this article include TSE:4385 TSE:6871 and TSE:8876.
Have feedback on this article? Concerned about the content? Get in touch with us directly. Alternatively, email editorial-team@simplywallst.com
