
 Yahoo Finance
 K&S (ASX:KSC) Might Have The Makings Of A Multi-Bagger
What are the early trends we should look for to identify a stock that could multiply in value over the long term? Amongst other things, we'll want to see two things; firstly, a growing return on capital employed (ROCE) and secondly, an expansion in the company's amount of capital employed. If you see this, it typically means it's a company with a great business model and plenty of profitable reinvestment opportunities. With that in mind, we've noticed some promising trends at K&S (ASX:KSC) so let's look a bit deeper.
What Is Return On Capital Employed (ROCE)?
For those who don't know, ROCE is a measure of a company's yearly pre-tax profit (its return), relative to the capital employed in the business. The formula for this calculation on K&S is:
Return on Capital Employed = Earnings Before Interest and Tax (EBIT) ÷ (Total Assets - Current Liabilities)
0.075 = AU$35m ÷ (AU$612m - AU$143m) (Based on the trailing twelve months to June 2023).
Therefore, K&S has an ROCE of 7.5%. Ultimately, that's a low return and it under-performs the Logistics industry average of 13%.
See our latest analysis for K&S
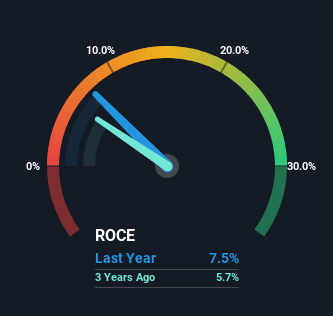
Historical performance is a great place to start when researching a stock so above you can see the gauge for K&S' ROCE against it's prior returns. If you'd like to look at how K&S has performed in the past in other metrics, you can view this free graph of past earnings, revenue and cash flow.
What Does the ROCE Trend For K&S Tell Us?
While in absolute terms it isn't a high ROCE, it's promising to see that it has been moving in the right direction. Over the last five years, returns on capital employed have risen substantially to 7.5%. Basically the business is earning more per dollar of capital invested and in addition to that, 24% more capital is being employed now too. So we're very much inspired by what we're seeing at K&S thanks to its ability to profitably reinvest capital.
The Bottom Line
In summary, it's great to see that K&S can compound returns by consistently reinvesting capital at increasing rates of return, because these are some of the key ingredients of those highly sought after multi-baggers. And a remarkable 111% total return over the last five years tells us that investors are expecting more good things to come in the future. In light of that, we think it's worth looking further into this stock because if K&S can keep these trends up, it could have a bright future ahead.
K&S does have some risks though, and we've spotted 1 warning sign for K&S that you might be interested in.
While K&S may not currently earn the highest returns, we've compiled a list of companies that currently earn more than 25% return on equity. Check out this free list here.
Have feedback on this article? Concerned about the content? Get in touch with us directly. Alternatively, email editorial-team (at) simplywallst.com.
This article by Simply Wall St is general in nature. We provide commentary based on historical data and analyst forecasts only using an unbiased methodology and our articles are not intended to be financial advice. It does not constitute a recommendation to buy or sell any stock, and does not take account of your objectives, or your financial situation. We aim to bring you long-term focused analysis driven by fundamental data. Note that our analysis may not factor in the latest price-sensitive company announcements or qualitative material. Simply Wall St has no position in any stocks mentioned.
