
 Yahoo Finance
 KE Holdings Inc. (NYSE:BEKE) Stock Has Shown Weakness Lately But Financials Look Strong: Should Prospective Shareholders Make The Leap?
With its stock down 5.7% over the past three months, it is easy to disregard KE Holdings (NYSE:BEKE). However, a closer look at its sound financials might cause you to think again. Given that fundamentals usually drive long-term market outcomes, the company is worth looking at. Particularly, we will be paying attention to KE Holdings' ROE today.
Return on equity or ROE is a key measure used to assess how efficiently a company's management is utilizing the company's capital. Simply put, it is used to assess the profitability of a company in relation to its equity capital.
See our latest analysis for KE Holdings
How Do You Calculate Return On Equity?
ROE can be calculated by using the formula:
Return on Equity = Net Profit (from continuing operations) ÷ Shareholders' Equity
So, based on the above formula, the ROE for KE Holdings is:
8.2% = CN¥5.9b ÷ CN¥72b (Based on the trailing twelve months to December 2023).
The 'return' is the yearly profit. Another way to think of that is that for every $1 worth of equity, the company was able to earn $0.08 in profit.
What Is The Relationship Between ROE And Earnings Growth?
Thus far, we have learned that ROE measures how efficiently a company is generating its profits. We now need to evaluate how much profit the company reinvests or "retains" for future growth which then gives us an idea about the growth potential of the company. Generally speaking, other things being equal, firms with a high return on equity and profit retention, have a higher growth rate than firms that don’t share these attributes.
A Side By Side comparison of KE Holdings' Earnings Growth And 8.2% ROE
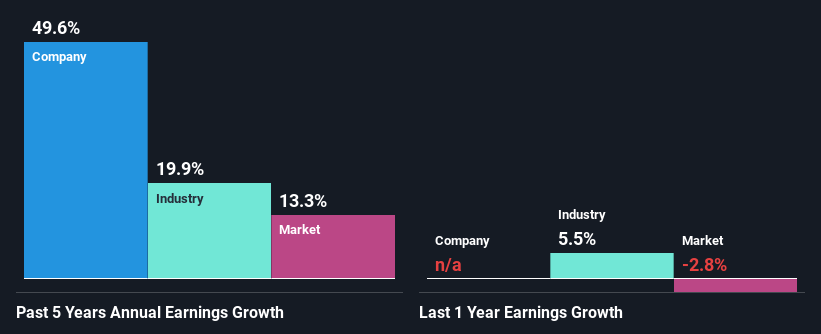
When you first look at it, KE Holdings' ROE doesn't look that attractive. However, the fact that the company's ROE is higher than the average industry ROE of 6.3%, is definitely interesting. Even more so after seeing KE Holdings' exceptional 50% net income growth over the past five years. That being said, the company does have a slightly low ROE to begin with, just that it is higher than the industry average. Hence, there might be some other aspects that are causing earnings to grow. E.g the company has a low payout ratio or could belong to a high growth industry.
We then compared KE Holdings' net income growth with the industry and we're pleased to see that the company's growth figure is higher when compared with the industry which has a growth rate of 20% in the same 5-year period.
Earnings growth is a huge factor in stock valuation. What investors need to determine next is if the expected earnings growth, or the lack of it, is already built into the share price. This then helps them determine if the stock is placed for a bright or bleak future. What is BEKE worth today? The intrinsic value infographic in our free research report helps visualize whether BEKE is currently mispriced by the market.
Is KE Holdings Making Efficient Use Of Its Profits?
KE Holdings has a three-year median payout ratio of 50% (where it is retaining 50% of its income) which is not too low or not too high. By the looks of it, the dividend is well covered and KE Holdings is reinvesting its profits efficiently as evidenced by its exceptional growth which we discussed above.
Existing analyst estimates suggest that the company's future payout ratio is expected to drop to 17% over the next three years. The fact that the company's ROE is expected to rise to 11% over the same period is explained by the drop in the payout ratio.
Summary
In total, we are pretty happy with KE Holdings' performance. Specifically, we like that it has been reinvesting a high portion of its profits at a moderate rate of return, resulting in earnings expansion. That being so, a study of the latest analyst forecasts show that the company is expected to see a slowdown in its future earnings growth. To know more about the company's future earnings growth forecasts take a look at this free report on analyst forecasts for the company to find out more.
Have feedback on this article? Concerned about the content? Get in touch with us directly. Alternatively, email editorial-team (at) simplywallst.com.
This article by Simply Wall St is general in nature. We provide commentary based on historical data and analyst forecasts only using an unbiased methodology and our articles are not intended to be financial advice. It does not constitute a recommendation to buy or sell any stock, and does not take account of your objectives, or your financial situation. We aim to bring you long-term focused analysis driven by fundamental data. Note that our analysis may not factor in the latest price-sensitive company announcements or qualitative material. Simply Wall St has no position in any stocks mentioned.
