
 Yahoo Finance
 Kellanova Co's Dividend Analysis
Exploring the Sustainability and Growth of Kellanova Co's Dividends
Upcoming Dividend Details
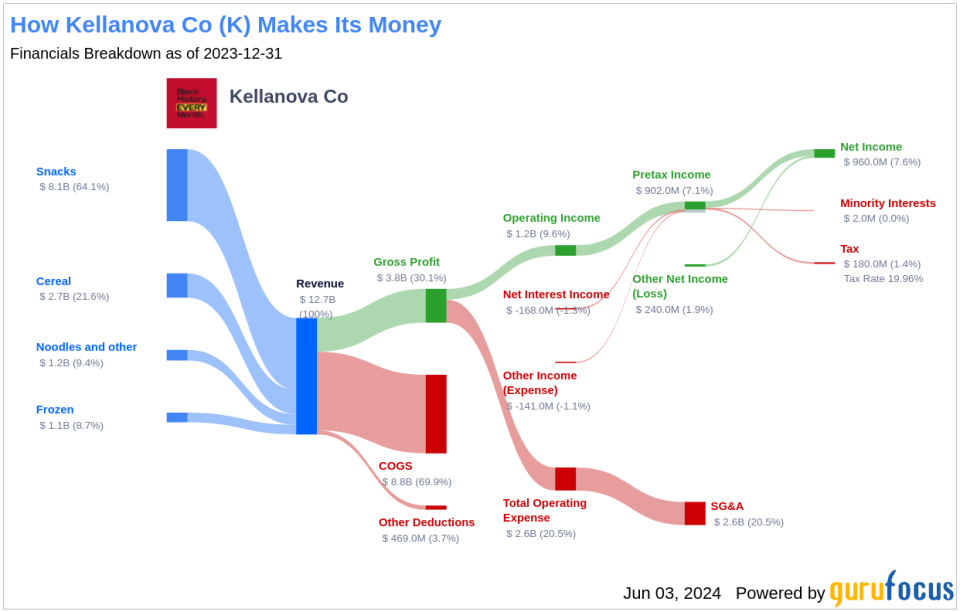
Kellanova Co (NYSE:K) recently announced a dividend of $0.56 per share, set to be payable on 2024-06-14, with the ex-dividend date on 2024-06-03. As investors anticipate this upcoming payment, it's crucial to delve into the company's dividend history, yield, and growth rates. Utilizing data from GuruFocus, this analysis will explore Kellanova Co's dividend performance and evaluate its sustainability.
Company Overview
This Powerful Chart Made Peter Lynch 29% A Year For 13 Years
How to calculate the intrinsic value of a stock?
Following its separation from the North American cereal sector, Kellanova Co, formerly known as the global snacking division of Kellogg, has emerged as a prominent global manufacturer and marketer of various food products. With a portfolio that includes Pringles, Cheez-It, and Eggo, the company operates in about 20 countries and markets its products in over 180 countries. Notably, international sales constitute roughly half of Kellanova's total sales, highlighting its global reach.
Dividend History and Status
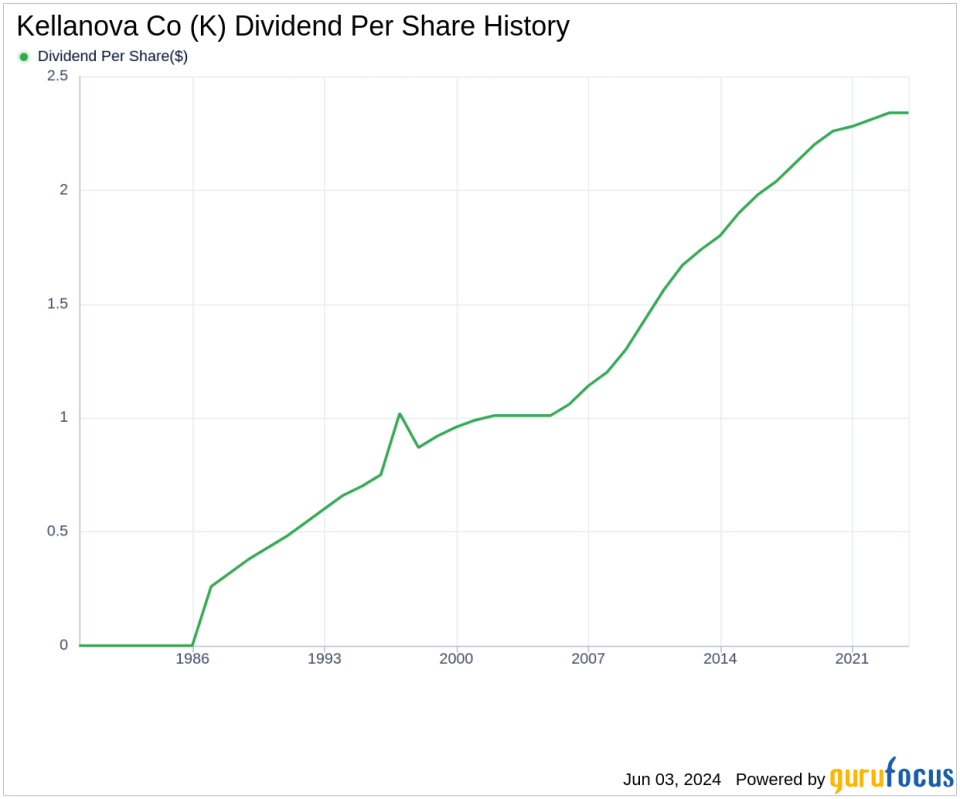
Kellanova Co has demonstrated a robust track record of consistent dividend payments since 1986, with distributions occurring quarterly. The company has achieved the status of a dividend aristocrat by increasing its dividend annually since 1997, marking over two decades of consistent growth.
Below is a chart illustrating the annual Dividends Per Share to track historical trends:
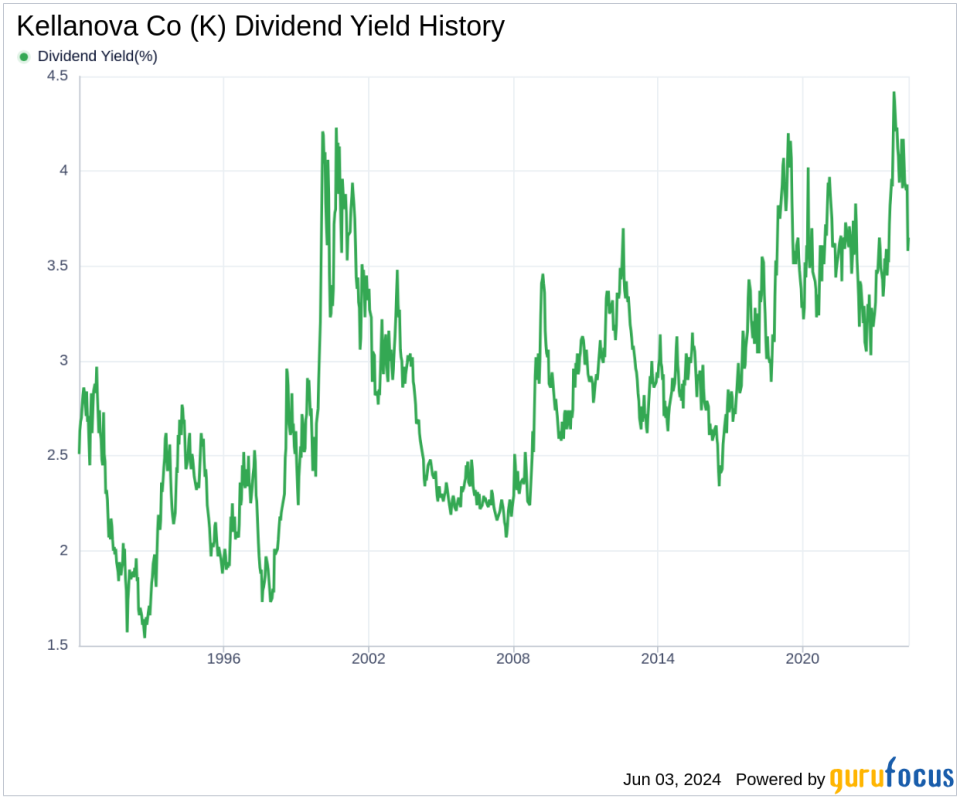
Dividend Yield and Growth Analysis
Currently, Kellanova Co boasts a trailing dividend yield of 3.83% and a forward dividend yield of 3.71%, indicating a slight expected decrease in dividend payments over the next 12 months. Over the past three years, the company's annual dividend growth rate was 0.90%, which increased to 1.20% over a five-year period and reached 2.70% over the past decade.
The 5-year yield on cost for Kellanova Co stock is approximately 4.07%, as per today's calculations.
Evaluating Dividend Sustainability
The sustainability of dividends is often gauged by the dividend payout ratio, which for Kellanova Co stands at 0.57 as of 2024-03-31. This ratio indicates a healthy balance between earnings distribution and retention for future growth. The company's profitability rank is 7 out of 10, reflecting strong earnings relative to its peers and a consistent track record of positive net income over the past decade.
Future Growth Prospects
Kellanova Co's growth metrics are crucial for maintaining dividend sustainability. With a growth rank of 7 out of 10, the company shows promising growth potential. However, its revenue and earnings growth rates over the past three years have underperformed relative to many global competitors, which could be a concern for future dividend sustainability.
Conclusion
While Kellanova Co has a commendable dividend history and a solid profitability rank, its recent growth metrics and the slight expected decrease in dividend payments necessitate careful monitoring by investors. For those interested in exploring further, GuruFocus Premium offers tools like the High Dividend Yield Screener to identify high-yield investment opportunities.
This article, generated by GuruFocus, is designed to provide general insights and is not tailored financial advice. Our commentary is rooted in historical data and analyst projections, utilizing an impartial methodology, and is not intended to serve as specific investment guidance. It does not formulate a recommendation to purchase or divest any stock and does not consider individual investment objectives or financial circumstances. Our objective is to deliver long-term, fundamental data-driven analysis. Be aware that our analysis might not incorporate the most recent, price-sensitive company announcements or qualitative information. GuruFocus holds no position in the stocks mentioned herein.
This article first appeared on GuruFocus.